
Fear and Greed Index Buy Signal | Extreme Fear at 10 or Below, Bitcoin Returns After 3, 7 and 30 Days
Since February 2018, the crypto Fear and Greed Index has read 10 or below on only 71 days. We bought bitcoin on paper on every one of them and checked the price 3, 7 and 30 days later. The short answer: a week later the average buy was up +3.2%, while a buy on a random day was up +0.8%.
So the old advice to buy fear holds up at the very bottom of the scale. Then the surprises start. Widen the rule a little and the edge is gone. Buying extreme greed did even better. And almost every fear buy got cheaper before it paid off.
In this article (11)
Fear and Greed Index at 10 or below: bitcoin returns after 3, 7 and 30 daysHow we ran the backtestWhat the crypto Fear and Greed Index is and how to read itIs extreme fear in crypto a buy signal at 25, 20 or 15?Five times the bitcoin fear and greed index fell to 10 or belowAfter a fear buy, did bitcoin drop further?The twist: buying extreme greed (90 and above) did betterWhat if you had held every fear buy until now?What this backtest can’t tell youHow to use the Fear & Greed Index when you buy bitcoinFear and greed index historical data: how we measured
Fear and Greed Index at 10 or below: bitcoin returns after 3, 7 and 30 days
Buying at 10 or below beat buying on a random day. The index hit that level on 71 days. Three days after those buys, bitcoin was up +1.7% on average. After 7 days it was up +3.2%, and after 30 days +5.1%. A buy on a random day made +0.8% over the same 7 days.
Of the 7-day trades, 42 of 69 ended in profit. The last 2 signal days don’t have a full week behind them yet, so they aren’t in that count.
One big trade can drag an average around, so we also show the median: the middle result, with half the trades above it and half below. The 7-day median was +1.5%, against +0.4% for a random day. Smaller, but still ahead.
Now say you had one pot of money. You buy on a signal, sell 7 days later and wait for the next signal. We call that rolling one trade at a time, and gains stack on gains. The pot grew +299% over 28 trades, while sitting in bitcoin for just 196 days.
| Hold | Bought at 10 or below: average (median) | Winning trades | Any day: average | Rolled one trade at a time |
|---|---|---|---|---|
| 3 days | +1.7% (+0.9%) | 42 of 69 | +0.3% | +105% |
| 7 days | +3.2% (+1.5%) | 42 of 69 | +0.8% | +299% |
| 30 days | +5.1% (+3.9%) | 49 of 69 | +3.8% | +285% |
Buy at the 00:00 UTC open on the day the index printed, sell at the 00:00 UTC open N days later. No fees.
The calculator runs the same test with your own settings: index level, days to hold and the year to start from. Type in a date and it shows that day’s index value and what bitcoin did 3, 7 and 30 days later. Your browser adds the newest days from the public data feeds. Nothing you type is sent to our server.
Why does 7 days look best? At 3 days the gain is tiny next to bitcoin’s normal swings. The worst 3-day trade ended at −16.0%.
At 30 days the fear buys made +5.1%, but a random day made +3.8%. Over a month bitcoin tended to rise anyway, so the gap shrinks.
How we ran the backtest
We replayed history with fixed rules and no hindsight. That’s all a backtest is: going back and checking what would have happened. We checked every day the signal fired, including the dull ones.
Why 10? The official extreme fear zone runs from 0 to 25, and that is wide. It covered 745 days. We wanted the rare days of real panic, so we started at 10 or below. The wider levels get their own test further down.
The index posts one value a day, stamped 00:00 UTC. That value mostly reflects the day before. So we buy at the 00:00 UTC open on the day the value appears. The open is simply the day’s first price. We sell at the 00:00 UTC open 3, 7 or 30 days later. In practice that is buying the moment you see the number.
Prices are Binance BTC/USDT daily candles. The main numbers leave fees out. The limits section shows what a 0.1% fee on each side does to them.
Signal days come in bunches. One crash can keep the index low for a week or more. So we count two ways. Days: each signal day is its own buy. Clusters: signal days less than two weeks apart count as one event. The 71 days make up 15 clusters.
The baseline buys on every day in the history with the same rule. That is 3,208 days in all. If fear days can’t beat it, the signal adds nothing. And when rolling one trade at a time, new signals are ignored while a trade is open.
What the crypto Fear and Greed Index is and how to read it
The crypto Fear and Greed Index is one number from 0 to 100 that sums up the mood in the bitcoin market. Low means fear. High means greed. It is published by alternative.me.
| Index value | Zone | What the market usually feels like |
|---|---|---|
| 0–25 | Extreme fear | Sharp drops, heavy selling and scary headlines |
| 26–46 | Fear | Prices sliding or stuck, people holding back |
| 47–54 | Neutral | No strong mood either way |
| 55–75 | Greed | Prices rising and more buyers joining in |
| 76–100 | Extreme greed | A fast rally with lots of hype and fear of missing out |
These cut-offs come from the labels in the site’s data feed. The web page itself only says that 0 means extreme fear and 100 means extreme greed.
Six ingredients go in: volatility (25%), momentum and volume (25%), social media (15%) and surveys (15%), which the page says are paused. Then bitcoin dominance, its share of the crypto market (10%), and Google search trends (10%). Where the paused 15% went isn’t stated, and we won’t guess.
It covers bitcoin only and updates once a day, stamped 00:00 UTC. The history starts on February 1, 2018.
The makers call the idea behind it “two simple assumptions”. The first: “Extreme fear can be a sign that investors are too worried. That could be a buying opportunity.” The same page says alternative.me “does not recommend that any cryptocurrency should be bought, sold, or held by you”. The site that makes the index does not tell you to buy or sell on it.
| Index | Built from | Extreme fear zone | Updates |
|---|---|---|---|
| alternative.me (used here) | Bitcoin volatility, momentum and volume, social media, dominance and search trends | 0 to 25 | Once a day, 00:00 UTC |
| CoinMarketCap | Top coins’ momentum, options-based volatility, put/call ratio, stablecoin supply and its own site data. Weights not published | Below 20 | Through the day |
| Exchange apps | Varies by app. Look for the source line in the app | Depends on the source | Depends on the source |
Different indexes give different numbers on the same day. So when someone says the index is at 8, ask which one. Everything in this article uses alternative.me. The stock market index with a similar name is something else, covered in the FAQ.
Is extreme fear in crypto a buy signal at 25, 20 or 15?
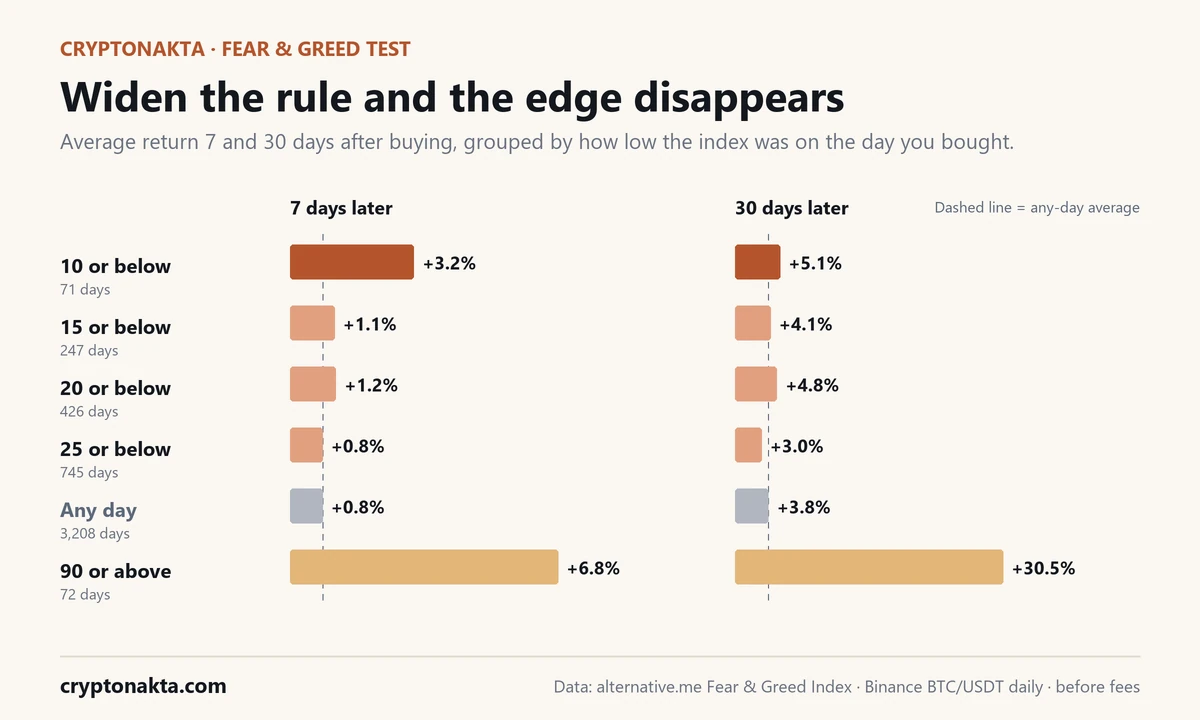
Not really. The whole extreme fear zone, 0 to 25, covered 745 days. Buying on all of them returned +0.8% after 7 days on average. That matches a random day. The signal only stood out at 10 or below.
The levels in between don’t help much either. At 15 or below the 7-day average was +1.1%. At 20 or below it was +1.2%. Both sit close to the random-day line.
| Bought when | Days | 7 days later: average | 7 days: in profit | 30 days later: average | 30 days: in profit |
|---|---|---|---|---|---|
| Index 10 or below | 71 | +3.2% | 61% | +5.1% | 71% |
| Index 15 or below | 247 | +1.1% | 56% | +4.1% | 64% |
| Index 20 or below | 426 | +1.2% | 58% | +4.8% | 62% |
| Index 25 or below | 745 | +0.8% | 56% | +3.0% | 58% |
| Any day (baseline) | 3,208 | +0.8% | 52% | +3.8% | 54% |
| Index 90 or above (extreme greed) | 72 | +6.8% | 64% | +30.5% | 86% |
Buy at the 00:00 UTC open on the day the index printed, sell at the 00:00 UTC open N days later. No fees.
Share this chart
Free to use on your site, blog or article with a credit link to CryptoNakta. Please keep the index credit (alternative.me) as well. Download image
Rolling one trade at a time makes the gap plain. At 25 or below the pot ended at −52%. At 10 or below it ended at +299%.
“Buy when there’s extreme fear” turns out to mean something narrower in the numbers. It held up in the deepest panic, the bottom of the scale. The rest of the extreme fear zone behaved like any other day.
Five times the bitcoin fear and greed index fell to 10 or below
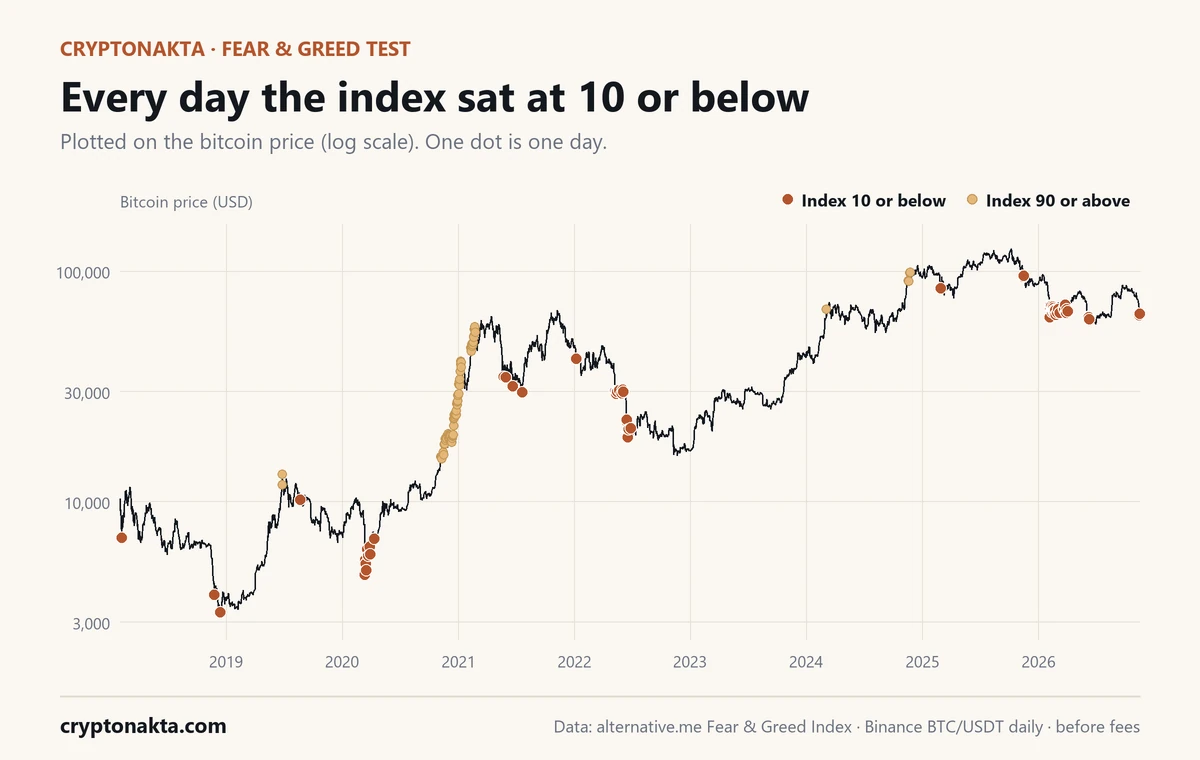
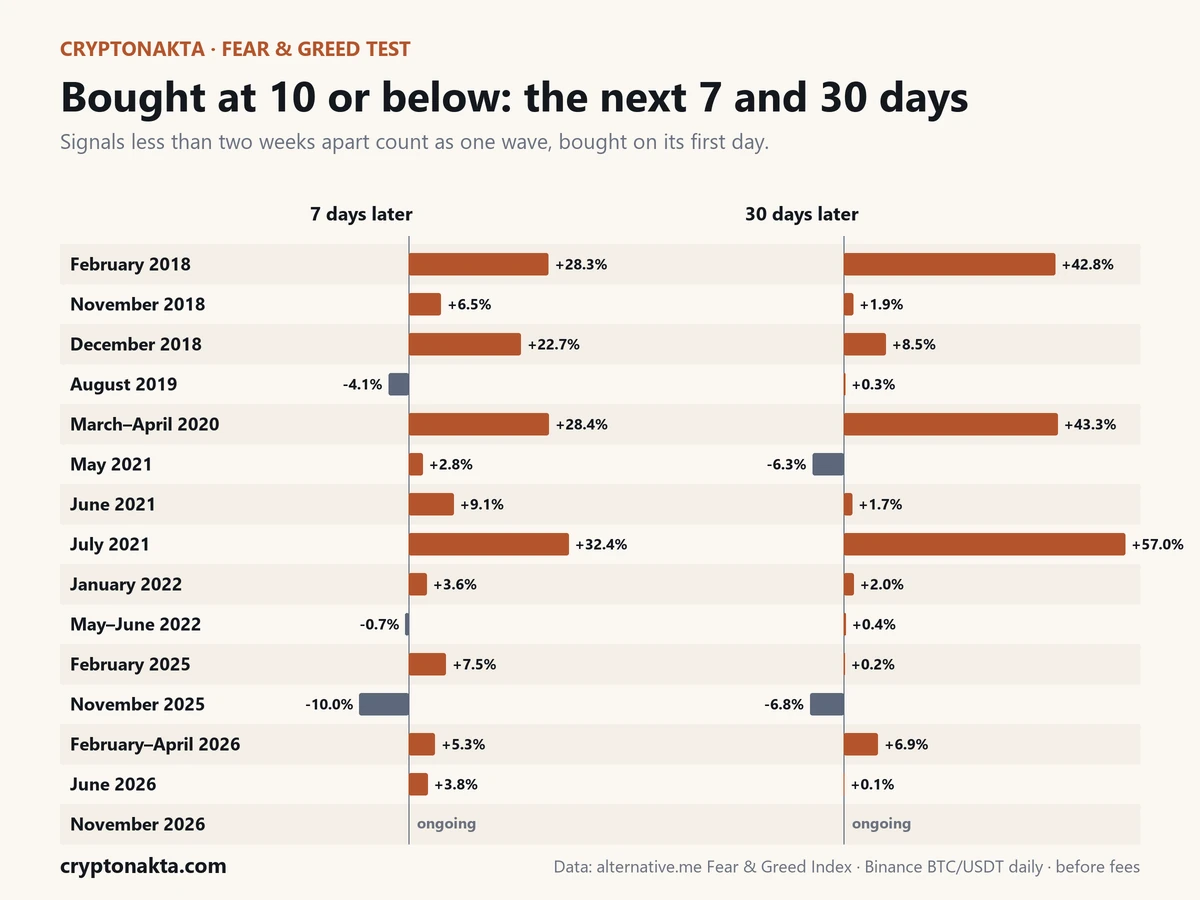
The 71 days fall into 15 clusters. The chart puts each one on the bitcoin price. Five of them show the whole range, from great buys to bad ones.
Share this chart
Free to use on your site, blog or article with a credit link to CryptoNakta. Please keep the index credit (alternative.me) as well. Download image
August 2019. No big headline, just a sharp one-day drop. The index went from the high 30s to 5 in two days and was back above 30 the next. A buy at $10,141 was −4.1% a week later and +0.3% after a month. A single-digit reading can be a blip.
March–April 2020. Covid fear hit every market at once, and bitcoin lost about half its price in two days. The index sat at 10 or below on 10 days. The first buy, at $4,800, was up +28.4% a week later and +43.3% after 30 days. This one cluster does a lot of the work in the averages.
May–June 2022. The Terra stablecoin lost its dollar peg and LUNA collapsed. Weeks later, crypto lenders started freezing withdrawals. The index read 10 or below on 18 days. The first buy at $30,074 was −0.7% after a week and +0.4% after a month.
November 2025. Bitcoin slid from its record high into the low $90,000s. Buying the first signal cost $94,594. A week later that buy was −10.0%, and a month later −6.8%. Held until now, it is still −31%.
February–April 2026. The index hit 5, its lowest reading ever, and stayed in single digits for more than ten days. Readings at 10 or below kept coming: 26 days, the biggest cluster on record. The first buy at $62,910 was up +5.3% after a week and +6.9% after a month. Held until now: +3%.
| When | Lowest index | Open on day one | 3 days | 7 days | 30 days | Lowest point in next 30 days | Held until now |
|---|---|---|---|---|---|---|---|
| February 2018 | 8 | $6,940 | +12.3% | +28.3% | +42.8% | never lower | +835% |
| November 2018 | 9 | $3,934 | −1.5% | +6.5% | +1.9% | −19.8% | +1,549% |
| December 2018 | 10 | $3,302 | −2.2% | +22.7% | +8.5% | −4.4% | +1,865% |
| August 2019 | 5 | $10,141 | −0.1% | −4.1% | +0.3% | −8.1% | +540% |
| March–April 2020 | 8 | $4,800 | +11.7% | +28.4% | +43.3% | −7.5% | +1,252% |
| May 2021 | 10 | $34,681 | +13.1% | +2.8% | −6.3% | −16.9% | +87% |
| June 2021 | 10 | $31,614 | +9.6% | +9.1% | +1.7% | −7.4% | +105% |
| July 2021 | 10 | $29,790 | +12.9% | +32.4% | +57.0% | never lower | +118% |
| January 2022 | 10 | $41,566 | +0.6% | +3.6% | +2.0% | −20.8% | +56% |
| May–June 2022 | 6 | $30,074 | −3.5% | −0.7% | +0.4% | −11.2% | +116% |
| February 2025 | 10 | $84,250 | +2.2% | +7.5% | +0.2% | −9.1% | −23% |
| November 2025 | 10 | $94,594 | −2.5% | −10.0% | −6.8% | −14.8% | −31% |
| February–April 2026 | 5 | $62,910 | +11.8% | +5.3% | +6.9% | −0.6% | +3% |
| June 2026 | 8 | $63,332 | −2.9% | +3.8% | +0.1% | −8.7% | +2% |
| November 2026 | 10 | $64,150 | – | – | – | ongoing | +1% |
One row per cluster: signals less than two weeks apart count as one. Returns are from the first signal day. A dash means not enough days have passed.
Share this chart
Free to use on your site, blog or article with a credit link to CryptoNakta. Please keep the index credit (alternative.me) as well. Download image
After a fear buy, did bitcoin drop further?
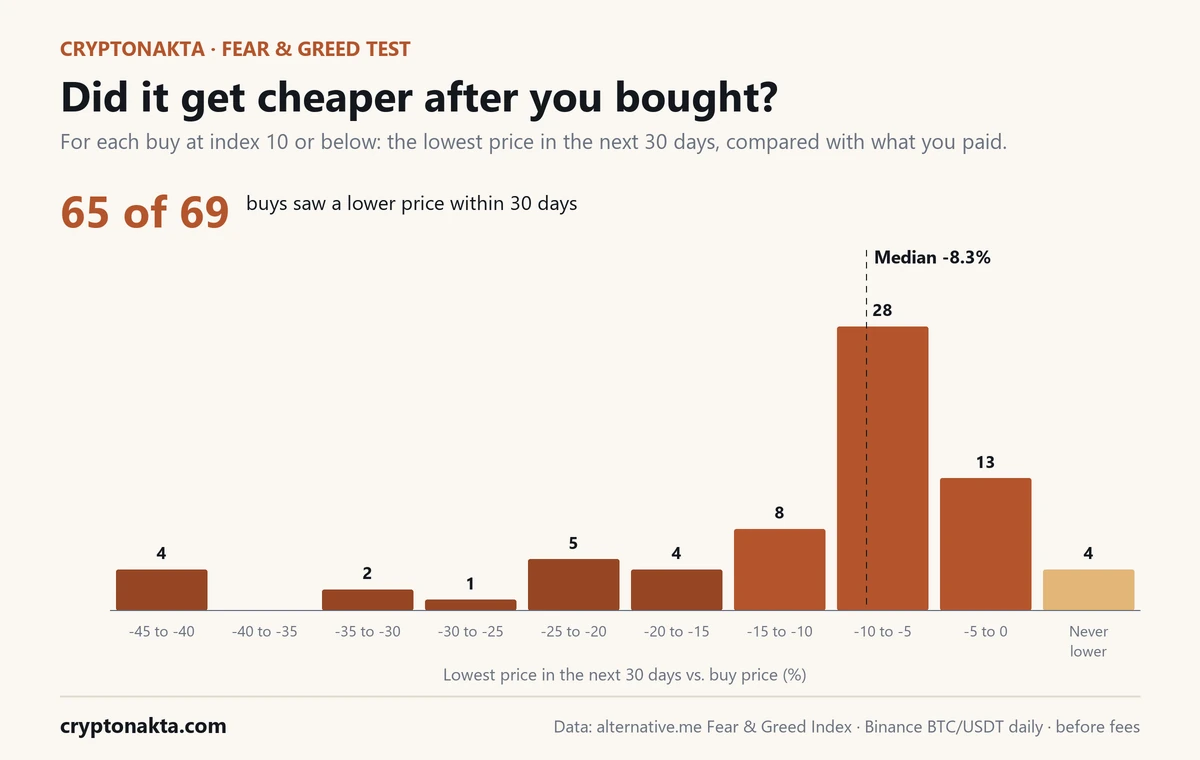
Yes, almost every time. In 65 of 69 buys, bitcoin traded below the buy price at some point in the next 30 days. The median dip was −8.3%. The worst was −42.1%. After a fear buy, a lower price usually came along.
Share this chart
Free to use on your site, blog or article with a credit link to CryptoNakta. Please keep the index credit (alternative.me) as well. Download image
This is the part a results table hides. The average says you made money, but your account showed a loss first. That is the moment many people give up and sell.
That is the case for not putting everything in on one day. If you split the money over several buys, or set up a recurring buy, a dip like this lowers your average price. It stops being a reason to panic.
The twist: buying extreme greed (90 and above) did better
Yes, really. On days the index read 90 or above, buying returned +30.5% after 30 days on average. That is far more than the fear buys made. There were 72 days like that.
Look at when they happened. Of those 72 days, 65 days fell in the 2020 to 2021 bull run. Greed readings are what a strong uptrend looks like from the inside. Buying them mostly meant buying into one rally that kept going.
This isn’t a tip to buy greed. It shows that the index follows the price more than it predicts it. An academic study of the same index found the same direction, covered in the limits section.
What if you had held every fear buy until now?
You would be up. But plain steady buying did better. Say you put $100 into bitcoin on each of the 71 days and held. That is $7,100 in. It is worth about $25,408 now, a gain of +258%.
Now compare. Buying the same small amount every day since February 2018, ignoring the index, made +295%. That is dollar-cost averaging: the same amount on a fixed schedule. And a single buy on the very first day at 10 or below, held the whole way, made +835%.
Why did the fear buys fall behind? Timing. 31 of the 71 signal days came in the latest stretch of signals. Those were bought close to the current price and have had little time to grow. Only 43 of 71 fear buys are in profit as of our measurement.
So the fear signal picked a few good entries. Over the long run it did not beat steady buying.
What this backtest can’t tell you
Quite a lot. Start with the sample. Days at 10 or below are rare, and a few big rebounds pull the average up. Take out the March 2020 cluster and the 7-day average falls from +3.2% to +1.7%. The three best trades alone make up 41% of all the 7-day results added together.
Then fees. Take out trading fees and every number gets smaller. With 0.1% charged on each buy and each sell, the rolled 7-day result drops from +299% to +278%. Spreads and slippage would cut a little more.
This is a record of the past. It is not a forecast. The market has changed since 2018, and so has the index, with its survey input paused. Use another index and the signal days move, so the results would too.
Researchers have tested this too. Szeberényi and Kovács (2026, Digital Finance) studied the same index from February 2018 to February 2026, using 1, 7 and 30 day returns. Higher readings came before slightly higher returns, which fits our greed result. Their real-time forecasts did no better than the plain historical average. They wrote that sentiment dashboards “should not be used as independent trading rules”.
You may also come across an analysis saying buys at 20 or below lost money, with a negative median. We reran that setup on our data: 20 or below, February 2018 to March 2025. The 7-day median came out +1.9% and the 30-day median +2.9%. We could not reproduce the loss. Results like these split on small choices: the cut-off, the dates, the buy and sell times, and picking famous examples over every day.
How to use the Fear & Greed Index when you buy bitcoin
Use it as a mood check, one input among several. If you act on it, a few habits keep the damage small.
Know which index you are reading. Our numbers only apply to alternative.me’s daily value.
Don’t go all in on one reading. Most fear buys got cheaper first. Splitting a planned buy over a few weeks, or running a recurring buy, deals with that.
Buy spot and skip leverage. Fear days are the most volatile days. With leverage, an ordinary dip like the −8.3% median can close your position before any rebound. Read why liquidations happen and how spot and futures differ first.
Keep fees low. A small edge disappears fast when you pay fees on the way in and out. Compare Binance fee tiers or the cheapest ways to buy bitcoin.
Check the number each day. Our daily crypto news notes that day’s index value. If you have never bought bitcoin, start with how to buy bitcoin.
The prices in this test come from the Binance spot market. Sign up there with our code and you get 10% of your spot trading fees back.
Binance

Affiliate disclosure: some links are partner links. We may earn a commission at no extra cost to you. This is not investment advice.
CRYPTONAKTA
Fear and greed index historical data: how we measured
Every number here comes from two public data sources. We pulled them and ran the test on November 17, 2026 03:56 UTC.
| Item | What we used |
|---|---|
| Index data | alternative.me Crypto Fear & Greed Index, full history (public API) |
| Price data | Binance BTC/USDT daily candles (public market-data API) |
| Period | February 1, 2018 to November 17, 2026, 3,208 days |
| Buy | Open at 00:00 UTC on the day the index printed |
| Sell | Open at 00:00 UTC, 3, 7 or 30 days later |
| “Now” | Open at 00:00 UTC on the measurement day: $64,883 |
| Fees | Not deducted in the main numbers; 0.1% per side shown separately |
| Measured | November 17, 2026 03:56 UTC |
Before publishing we downloaded both data sets a second time. Every past day matched the first download.
Old index values don’t get rewritten. We compared our copy with three archived copies of the full history, saved in November 2022, May 2025 and March 2026. Not a single day differed.
The index data belongs to alternative.me, and their terms ask for credit right next to the data. Every table, chart and the calculator carries it.
To repeat the test, pull the full index history from the alternative.me API (limit=0) and Binance BTC/USDT daily candles (klines). Buy at the 00:00 UTC open on each signal day and sell at the open 3, 7 or 30 days later.
Fear and Greed Index questions
- alternative.me: Crypto Fear & Greed Index · checked November 17, 2026
- alternative.me: Crypto API (Fear & Greed Index) · checked November 17, 2026
- Binance: Spot API: Market data endpoints (Kline/Candlestick data) · checked November 17, 2026
- CoinMarketCap: Crypto Fear and Greed Index · checked November 17, 2026
- Szeberényi & Kovács (2026), “Fear, greed and bitcoin return distributions”, Digital Finance · checked November 17, 2026
Index data: alternative.me Crypto Fear & Greed Index. Prices: Binance BTC/USDT daily candles. Past results are not a forecast. Nothing here is investment advice.