Bitcoin Halving | Next Halving Date, Price After Each Halving, Days to the Peak and the 4-Year Cycle
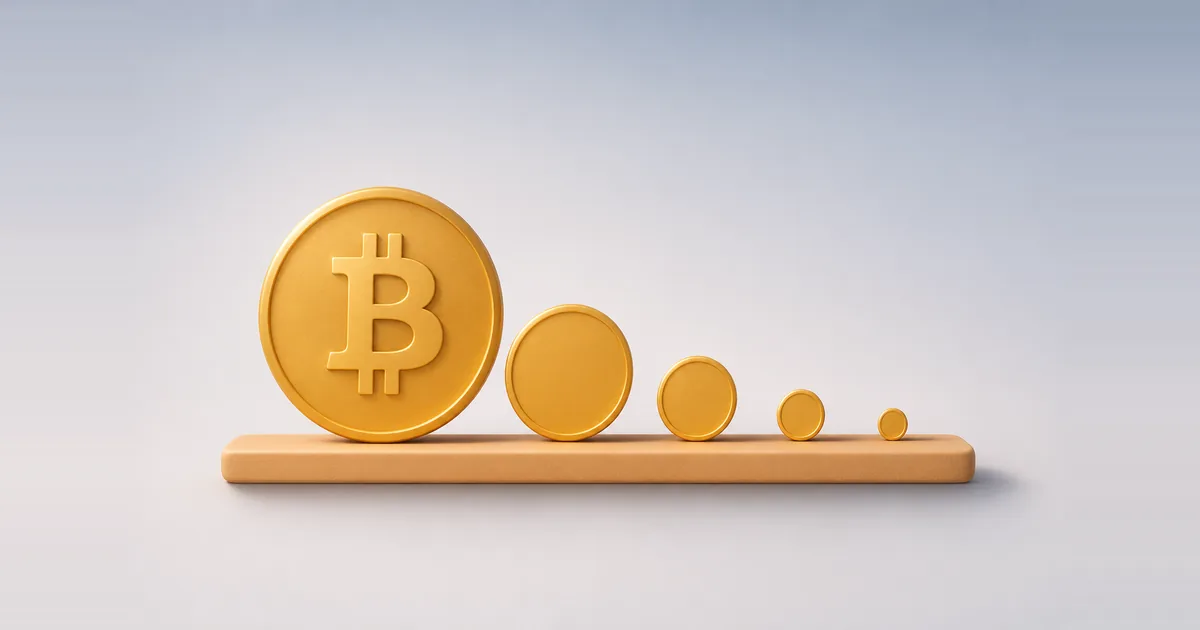
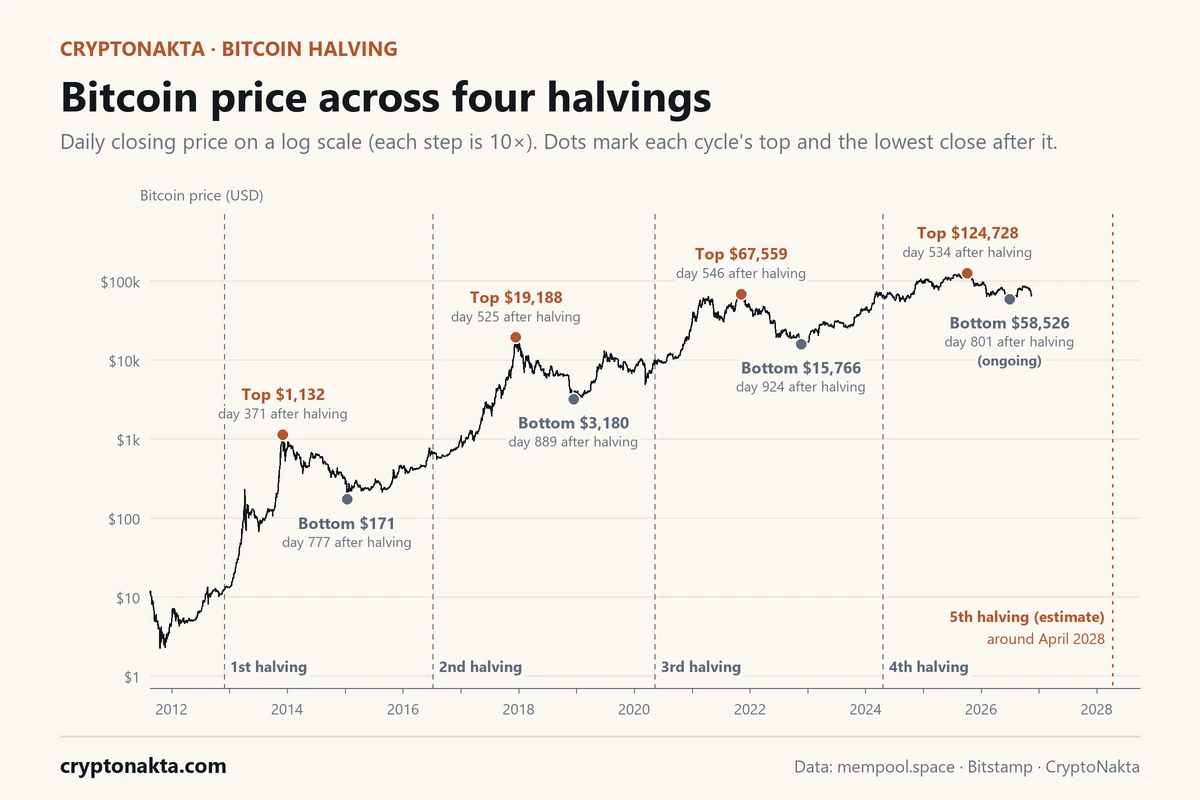
We followed bitcoin’s daily closing price through every bitcoin halving so far. Each time, a new cycle top followed 371 to 546 days later. From the second halving on, the timing was fairly steady. The size was not. The climb from halving day to the top went 92.6× → 29.6× → 7.9× → 1.9×.
The next halving is block 1,050,000, due in 2028. The old line says “halving, then a rally.” On timing, it held four times out of four. On size, each cycle gave less. And last time, buying on halving day did worse than buying on a typical day.
In this article (13)
Bitcoin price after each halving: 30 days to 2 years laterHow long after the halving does bitcoin peak?What happened after each cycle topWhen is the next bitcoin halving? Block 1,050,000 and the countdownBitcoin halving dates and block rewards, 2012 to 2024What is the bitcoin halving, and why about every four years?Where the current halving cycle stands, day for dayDid buying on halving day beat buying on any other day?Does bitcoin drop before or after the halving?Is the 4-year cycle dead? ETFs, rates and the halvingWhat the halving means for miners: hashrate, fees and the last bitcoinWhat you can actually do before the next halvingHow we measured: data, rules and how to check it yourself
Bitcoin price after each halving: 30 days to 2 years later
Bitcoin was higher one year after every halving so far. The first few months went both ways, though. And the one-year gain didn’t shrink in a straight line: 2020 beat 2016.
| Halving | Price on halving day | 30 days later | 90 days | 180 days | 1 year | 2 years |
|---|---|---|---|---|---|---|
| 1st (2012) | $12.22 | +8% | +155% | +933% | +8,190% | +2,984% |
| 2nd (2016) | $648 | −9% | −5% | +55% | +286% | +929% |
| 3rd (2020) | $8,572 | +15% | +36% | +73% | +562% | +238% |
| 4th (2024) | $64,990 | +10% | +3% | +4% | +31% | +17% |
Bitstamp BTC/USD daily closing price (UTC day). Change measured from the close on the halving day. No fees.
Thirty days after the halving, results ranged from −9% to +15%. In 2016 the price was still −5% versus halving day at the 90-day mark.
The one-year column is where the famous halving numbers come from. After 2012 it was +8,190%. After 2024 it was +31%.
Why are the one-year numbers so big? Each cycle top came a year to a year and a half after the halving. So the one-year mark came while the price was still climbing. By year two, every top had passed. In three of the four cycles, the price was lower than at year one.
How long after the halving does bitcoin peak?
In order, the four cycle tops came 371 · 525 · 546 · 534 days after their halving. After the first cycle, the timing barely moved. The size shrank every time.
| Halving | Days to the cycle top | Top (closing price) | Top vs halving-day price | Fall from top to bottom | Bottom to next halving |
|---|---|---|---|---|---|
| 1st (2012) | 371 days | $1,132 (December 2013) | 92.6× | −85% | 542 days |
| 2nd (2016) | 525 days | $19,188 (December 2017) | 29.6× | −83% | 513 days |
| 3rd (2020) | 546 days | $67,559 (November 2021) | 7.9× | −77% | 516 days |
| 4th (2024) | 534 days | $124,728 (October 2025) | 1.9× | −53% (ongoing) | ongoing |
Top = highest daily close within two years after the halving. Bottom = lowest close after that top and before the next halving (for the current cycle: up to the measurement day, so it can still change).
Share this chart
Free to use on your site, blog or article with a credit link to CryptoNakta. Please keep the data credit (mempool.space · Bitstamp) as well. Download image
So the timing looks steady. Three of the four tops landed between day 525 and day 546, about a year and a half after the halving.
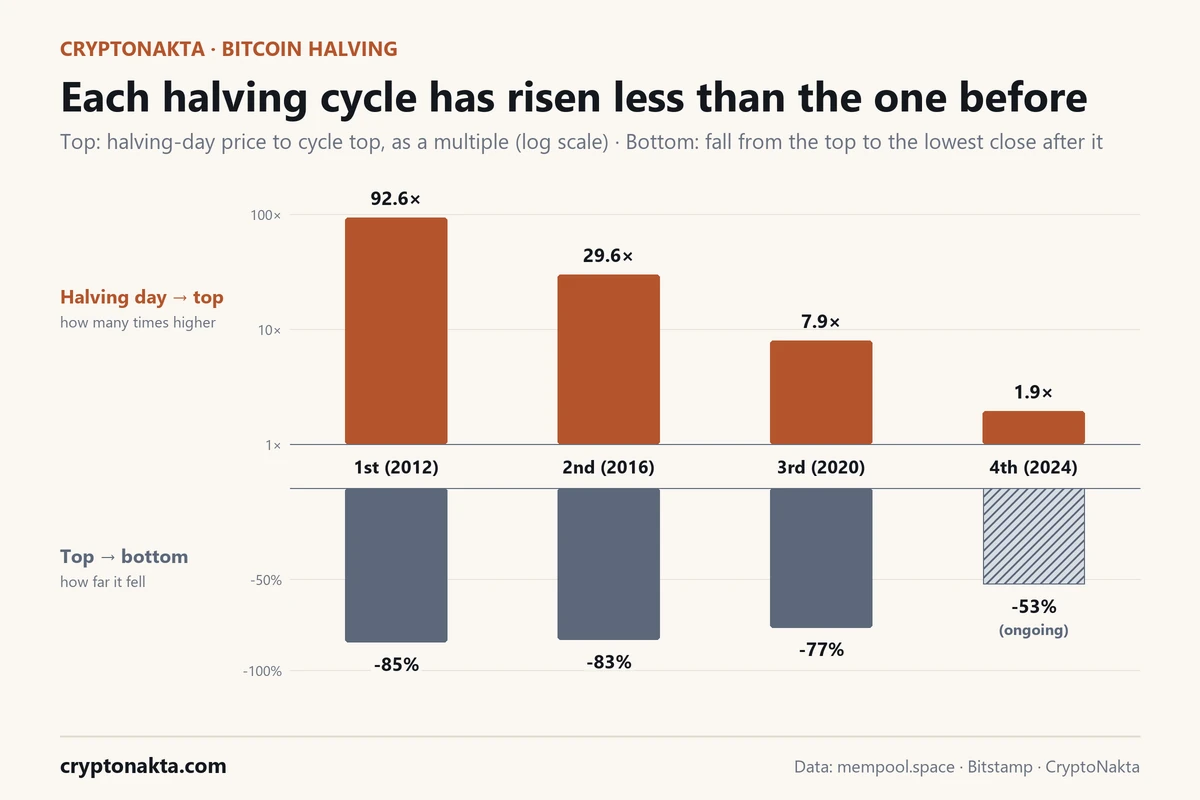
From halving day to the top, bitcoin rose 92.6× → 29.6× → 7.9× → 1.9×. The first cycle peaked at 92.6× the halving-day price, the latest at 1.9×. The rise after each halving got smaller every time.
One detail if you compare sources. We use the daily close, the last price of each UTC day. By that measure the latest top was $124,728 on October 6, 2025. Intraday, bitcoin touched $126,272. Sites that use intraday highs, or an average of many exchanges, can show a different number and even a different day.
What happened after each cycle top
Each cycle top was followed by a deep fall. In the first three cycles, the fall from top to bottom was −85% · −83% · −77%. In the current cycle, the lowest close so far is −53% from the top.
Share this chart
Free to use on your site, blog or article with a credit link to CryptoNakta. Please keep the data credit (mempool.space · Bitstamp) as well. Download image
That low close was $58,526 on June 30, 2026. It put bitcoin at −10% versus its 2024 halving-day price.
After each bottom, the next halving came 542 · 513 · 516 days later. In past cycles, the bottom came about a year and a half before the next halving.
The current cycle is still open. Its numbers only run to the day we measured, so its low can still change. What the record shows so far: the climb was smaller this time, and the fall has been shallower too. Past cycles can’t tell you whether that holds.
When is the next bitcoin halving? Block 1,050,000 and the countdown
The next bitcoin halving happens at block 1,050,000. At the pace of the past six months, that lands in April 2028. When we measured, there were 73,554 blocks to go. At that block, the block reward (new bitcoin paid for each block mined) drops from 3.125 BTC to 1.5625 BTC.
Why do countdown sites show different dates for the next halving? Blocks don’t arrive on a timetable. The target is one every 10 minutes, but the real average drifts. Over tens of thousands of blocks, a small drift adds up.
Here is how much it moves. At the 10-minute target, the estimate is April 12, 2028. The six-month average of 600.2 seconds per block gives the same day. At the pace of the last two weeks (632.8 seconds), it slips to May 10, 2028.
That is why trackers disagree by weeks, anywhere from late March to May. Treat any exact date and time as an estimate.
The calculator counts down from the latest block number. Your browser pulls it straight from mempool.space. Pick a block interval and see how one extra second per block moves the date. It also finds the block reward for any block number or year. And it shows where past cycles stood on today’s day count. Nothing you type is sent to our server.
Bitcoin halving dates and block rewards, 2012 to 2024
Bitcoin has had four halvings so far, in 2012, 2016, 2020 and 2024. Each one came at a set block number, exactly 210,000 blocks after the last.
| Halving | Block | Date and time (UTC) | Block reward | Days since the previous halving | New BTC per day after |
|---|---|---|---|---|---|
| 1st (2012) | 210,000 | 2012-11-28 15:24 | 50 BTC → 25 BTC | – | 3,600 BTC |
| 2nd (2016) | 420,000 | 2016-07-09 16:46 | 25 BTC → 12.5 BTC | 1,319 days | 1,800 BTC |
| 3rd (2020) | 630,000 | 2020-05-11 19:23 | 12.5 BTC → 6.25 BTC | 1,402 days | 900 BTC |
| 4th (2024) | 840,000 | 2024-04-20 00:09 | 6.25 BTC → 3.125 BTC | 1,439 days | 450 BTC |
| 5th (next) | 1,050,000 | around April 2028 (estimate) | 3.125 BTC → 1.5625 BTC | – | 225 BTC |
Times are the block timestamps. “New BTC per day” assumes 144 blocks a day (one every 10 minutes). The next date is an estimate from the recent block pace and moves as that pace changes.
All times are UTC, so the date can differ by a day between sources. Block 840,000 arrived at 00:09 UTC on April 20, 2024. In New York it was still the evening of April 19.
The 2024 halving block stood out for another reason. Its fees came to 37.63 BTC, about 12× the new 3.125 BTC reward. That same block switched on Runes, a way to make tokens on bitcoin. The Runes docs put it plainly: “The Runes protocol activates on block 840,000.”
What is the bitcoin halving, and why about every four years?
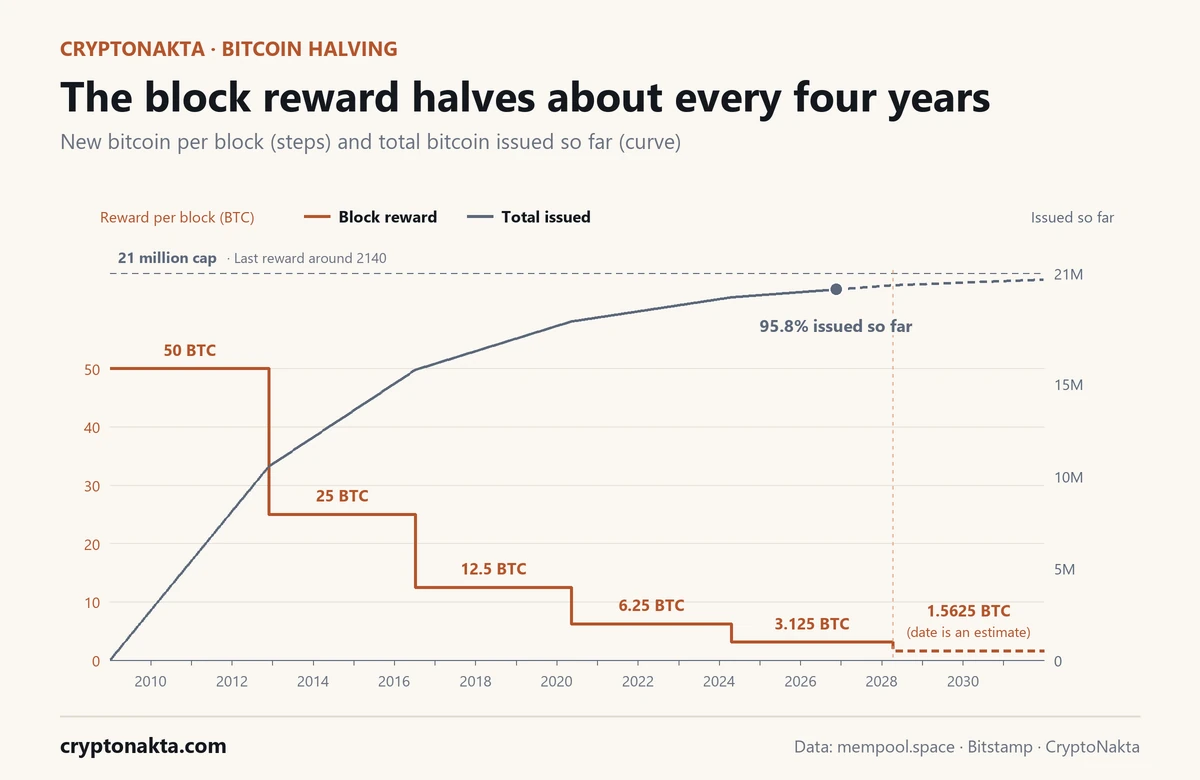
A bitcoin halving is the moment the block reward gets cut in half. It comes every 210,000 blocks. The block reward is the new bitcoin a miner receives for adding a block to the chain. The trigger is a block number, so the calendar plays no part. Some people call it the “halvening.” The reward was 50 BTC when bitcoin launched in 2009. After four cuts, it is 3.125 BTC.
Share this chart
Free to use on your site, blog or article with a credit link to CryptoNakta. Please keep the data credit (mempool.space · Bitstamp) as well. Download image
| At a halving, this changes | This stays the same |
|---|---|
| New bitcoin per block (the block reward) is cut in half | The bitcoin already in your wallet |
| New bitcoin per day: 450 BTC now, 225 BTC after the next halving | The 21 million cap |
| How much miners earn from new coins | The 10-minute block target |
| How fast new supply grows each year | How you send, receive or store bitcoin |
Why about four years? At one block every 10 minutes, 210,000 blocks take about 1,458 days, just under four years. Bitcoin’s own code says the cut happens “approximately every 4 years.” In practice the gaps were shorter, between 1,319 days and 1,439 days.
The reason is the difficulty adjustment. Every 2,016 blocks (about two weeks), the network makes the mining puzzle harder or easier. The goal is to keep blocks near 10 minutes apart. But miners keep adding machines between resets. So blocks come a little faster than 10 minutes, and each halving arrived early.
Halvings are also why bitcoin has a hard limit. The exact maximum is 20,999,999.9769 BTC. Amounts are stored in whole satoshis (the smallest unit), and each cut drops the leftover fraction. The last block with any reward is number 6,929,999, around the year 2140. After that, miners earn only fees.
Satoshi Nakamoto laid out the plan in an email on January 8, 2009, announcing Bitcoin v0.1: “Total circulation will be 21,000,000 coins. It’ll be distributed to network nodes when they make blocks, with the amount cut in half every 4 years.” The white paper itself never mentions the halving or the 21 million figure. See also Satoshi’s genesis address.
Where the current halving cycle stands, day for day
Bitcoin is roughly back where this halving cycle started. After 941 days, the price is −0.2% versus the 2024 halving-day close of $64,990. At the same point, every earlier cycle was still far above its halving-day price.
| Cycle | Same day count after the halving | Price that day | vs halving-day price | vs that cycle’s top |
|---|---|---|---|---|
| 1st (2012) | June 27, 2015 | $251 | +1,956% | −78% |
| 2nd (2016) | February 5, 2019 | $3,431 | +430% | −82% |
| 3rd (2020) | December 8, 2022 | $17,229 | +101% | −74% |
| 4th (2024) | November 17, 2026 | $64,877 | 0% | −48% |
Every row is the same number of days after its halving as the last row (the measurement day): 941 days.

Share this chart
Free to use on your site, blog or article with a credit link to CryptoNakta. Please keep the data credit (mempool.space · Bitstamp) as well. Download image
The 2012 cycle stood at +1,956% against its halving-day price at this point. The 2016 cycle was at +430%, and the 2020 cycle at +101%.
Measured from the top, this cycle looks much more familiar. Bitcoin is −48% from its cycle top. At the same day count the earlier cycles were −78%, −82% and −74% from theirs.
Earlier cycles climbed so far that even after the crash they stayed well above the halving-day price. This halving cycle never climbed that far.
What this shows is a difference in size. The timing matched the 2016 and 2020 cycles, but the climb was much smaller. Everything here is a record of the last four halvings. None of it is a forecast.
Did buying on halving day beat buying on any other day?
Three times out of four it did. In 2024 it didn’t. Bitcoin bought on the 2024 halving day and held one year returned +31%. Bought on a typical day within two years either side, the one-year result (the median) was +57%.
| Halving | Bought on halving day: 1 year later | Bought on any day within 2 years either side: typical 1-year result (median) | Share of those days that were up a year later |
|---|---|---|---|
| 1st (2012) | +8,190% | +277% | 69% |
| 2nd (2016) | +286% | +119% | 77% |
| 3rd (2020) | +562% | +34% | 64% |
| 4th (2024) | +31% | +57% | 68% |
Median = the middle result when all those days are lined up from worst to best. Same closing-price rule as above.
“Any other day” means every day within two years before or after each halving, each held one year. We lined those results up from worst to best and took the middle one, the median. A few wild days can’t drag it around the way they drag an average.
In the first three cycles, halving day won by a wide margin. A buy on halving day caught the start of the climb. In 2024, a big part of the rise came before the halving. Bitcoin gained 138% in the year before it. Buying on halving day did not always beat buying on any other day.
For a wider yardstick, take every day in our price data and hold for one year. The median result was +85%. And 71% of those days were up a year later.
Does bitcoin drop before or after the halving?
Yes, on both sides, at least for a while. Twice, the price fell below its halving-day level within 90 days: −17% in 2016 and −14% in 2024.
| Halving | Biggest drop in the 90 days before | Year before the halving | Lowest point in the 90 days after |
|---|---|---|---|
| 1st (2012) | −22% | +349% | never below the halving-day price |
| 2nd (2016) | −22% | +127% | −17% (24 days) |
| 3rd (2020) | −53% | +23% | never below the halving-day price |
| 4th (2024) | −16% | +138% | −14% (78 days) |
Bitstamp BTC/USD daily closing price (UTC day). Change measured from the close on the halving day. No fees.
Before the halving, the pattern is even more regular. In the 90 days before each one, the biggest drop from a recent high ranged from −16% to −53%.
The −53% needs context. That drop ran into March 2020, when the COVID-19 crash hit every market at once. It had nothing to do with the halving.
In both cycles that dipped below the halving-day price, it was back above that level within six months. In all four cycles, the price was higher a year later.
Is the 4-year cycle dead? ETFs, rates and the halving
Maybe. The 2024 cycle broke the old pattern in one clear way. Bitcoin passed its previous all-time high 47 days before the halving. In the 2016 and 2020 cycles, that only happened after the halving (229 · 203 days after, in that order).
The first close above the 2021 high came on March 4, 2024. On-chain research firm Glassnode called it “the first such time this has occurred.” It pointed to the new U.S. spot ETFs as “a significant new source of demand.”
Those are exchange-traded products: funds that hold actual bitcoin and trade on a stock exchange. The SEC approved them on January 10, 2024. The chair’s statement that day added: “we did not approve or endorse bitcoin.” Since then, the 4-year cycle has been argued over openly. Three well-known positions:
| Who | When | Is the 4-year cycle dead? | Main reason given |
|---|---|---|---|
| Arthur Hayes, BitMEX co-founder | October 2025 essay | Dead | Bitcoin follows the supply of dollars and yuan |
| Matt Hougan, Bitwise CIO | December 2025 memos | Dead | Each halving matters half as much as the last; rates and leverage changed too |
| Alex Thorn, Galaxy Research | June 2026 report | Still intact | Tops and bottoms keep the old timing, with smaller swings |
Our numbers give each side something. The timing held: the top came 534 days after the halving, in line with the 2016 and 2020 cycles. The size did not hold. The climb was much smaller, and so far the drop has been too.
Each cycle also had other big events. In 2020 came the COVID-19 crash. In 2024 the ETFs arrived. Big forces like interest rates kept shifting the whole time. Other things moved the price in the same years, so the halving’s own effect can’t be pulled apart from them.
Four halvings is a small sample, too small to call a rule.
What the halving means for miners: hashrate, fees and the last bitcoin
For miners, the halving is an overnight pay cut. Yet the network barely flinched. Hashrate means the total computing power mining bitcoin. Its biggest dip around a halving was −11.5% in 2020 (30 days before vs. 30 days after). And few coins are left to mine: 95.8% of all 21 million bitcoin has already been issued.
| Halving | Hashrate: 30 days before → 30 days after | Change | Back to the pre-halving level after | Fees in the halving block |
|---|---|---|---|---|
| 1st (2012) | 24 TH/s → 23 TH/s | −7.2% | 4 days | 13.56 BTC |
| 2nd (2016) | 1.51 EH/s → 1.50 EH/s | −0.4% | 4 days | 0.58 BTC |
| 3rd (2020) | 115 EH/s → 102 EH/s | −11.5% | 32 days | 0.91 BTC |
| 4th (2024) | 615 EH/s → 601 EH/s | −2.2% | 4 days | 37.63 BTC |
Hashrate = daily network estimate from mempool.space, averaged over 30 days. “Back to level” = first day the 7-day average reached the 30-day pre-halving average.
In 2020 the hashrate took 32 days to get back to its pre-halving level. In 2024 the 30-day average moved only −2.2%.
Miners track their pay with hashprice. Luxor defines it as what a set amount of computing power can expect to earn per day. A halving cuts the new-coin part of it in half in one block.
Public miners’ quarterly filings show the hit. Riot Platforms reported producing 52% fewer bitcoin in the second quarter of 2024 than a year earlier. MARA reported 30% fewer. Both also named rising network difficulty, so the halving was one cause among several.
Can fees fill the gap? Fidelity Digital Assets puts them at “around 1% outside of bull markets” as a share of miner revenue. In the last 144 blocks before we measured, fees were 0.7% of what miners earned.
For everyone else the halving means less new supply. At the next halving, new coins per day drop from 450 BTC to 225 BTC. New supply per year falls from about 0.82% of all coins to about 0.40%. See also how bitcoin mining works.
What you can actually do before the next halving
Skip the idea of one perfect buy timed to the halving date. Twice, the price dipped in the weeks after the halving. And in 2024, halving day was a worse entry than a typical day.
If you want to own bitcoin, spreading buys over months takes the date out of it. Here is how to set up a recurring buy (DCA) on Binance or Bybit. Our average cost calculator shows what your average price becomes as you add.
To see the market’s mood as a number, look at the Fear and Greed Index.
Stick to spot buying. Spot and futures behave very differently in a dip. Take a 14% slide after the halving, like the one in 2024. If you own the coin, you can ride it out. With leverage, the same slide can close your position. Here is why liquidations happen.
Fees eat into small, repeated buys. Compare the cheapest ways to buy bitcoin and Binance trading fees. New to all of it? Start with how to buy bitcoin.
Then decide where it lives. A hardware wallet keeps it off the exchange. If you’d rather hold a fund than coins, compare bitcoin ETFs with buying bitcoin.
Binance

Affiliate disclosure: some links are partner links. We may earn a commission at no extra cost to you. This is not investment advice.
CRYPTONAKTA
How we measured: data, rules and how to check it yourself
Every price in this article is Bitstamp’s BTC/USD daily close. Every block time is the timestamp written in the block itself.
| Item | What we used |
|---|---|
| Block data | mempool.space public API: halving block timestamps, current height, block pace, hashrate, fees |
| Price data | Bitstamp BTC/USD daily candles (public API), from 2011 |
| Price rule | Daily close on the UTC day; halving day = UTC date of the halving block |
| Cycle top / bottom | Top = highest close within 2 years after the halving; bottom = lowest close after that top, before the next halving |
| Baseline | Every day within 2 years either side of each halving, bought and held 1 year |
| Next halving | Block 1,050,000; remaining blocks × average block time (last 2 weeks / last 6 months / since the last halving) |
| Height at measurement | 976,446 |
| Measured | November 18, 2026 14:12 UTC |
Measured: November 18, 2026 14:12 UTC.
Prices around 2013 and earlier varied a lot between exchanges. Early numbers from other sources can differ from ours.
To redo it, you need two free public APIs. Use mempool.space for blocks and Bitstamp’s OHLC endpoint for daily prices. Take the UTC date of each halving block, read that day’s close and apply the rules above.
Bitcoin halving questions
- mempool.space: REST API
- Bitstamp: HTTP API (OHLC)
- Bitcoin Core: src/validation.cpp (GetBlockSubsidy)
- Bitcoin Core: src/kernel/chainparams.cpp (nSubsidyHalvingInterval)
- Bitcoin Core: src/pow.cpp (difficulty adjustment)
- Satoshi Nakamoto: Bitcoin v0.1 released (cryptography mailing list, 2009-01-08)
- Satoshi Nakamoto: Bitcoin: A Peer-to-Peer Electronic Cash System
- Bitcoin Wiki: Controlled supply
- Ordinals: Runes
- U.S. SEC: Release No. 34-99306 (spot bitcoin ETP approval order)
- Glassnode: The Week On-chain, Week 10 2024
- Luxor Hashrate Index: Hashprice
- Fidelity Digital Assets: The economics of the bitcoin halving: a miner’s perspective
- Galaxy Research: Bitcoin four-year cycle: where is the bottom?
- Bitwise: The four-year cycle is dead (CIO memo)
- Bitwise: Bitwise predictions for 2026 (CIO memo, 2025-12-15)
- Arthur Hayes: Long Live the King
All sources checked November 18, 2026. Block data: mempool.space public API. Prices: Bitstamp BTC/USD daily closes. Past cycles are a record, not a forecast. Nothing here is investment advice.