
Crypto Average Cost Calculator | Averaging Down, Binance Average Cost Wrong or Missing, Lower Your Average
Tap Revise on your Binance Average Cost and the app warns you: “the previous average cost data will be deleted and cannot be restored”. People get there because the number looks wrong. Usually it is counting something else, like coins you moved in or got free. Your real average cost is money spent ÷ coins received. Averaging down pulls your break-even price closer, and it also grows the money you can lose.
Below: where Binance, Bybit and OKX keep the number, a calculator that handles fees, and a test of averaging down on 25 coins. On past prices, most cases got back to even faster. The ones that kept falling lost far more.
In this article (11)
Where to find your average cost on Binance, Bybit and OKX (and how to revise it)Why your Binance average cost looks wrongHow to calculate your average buy price in cryptoCrypto average price calculator with fees and a target averageHow averaging down moves your break-even priceDoes averaging down crypto get you back to even sooner?When the price kept falling: all four extra buys usedAveraging down near a top: bitcoin, Ethereum, Solana and AXSBuy more every 10%, 20% or 30%? What the gap changesIf you average down on spot, set these limits firstHow we measured, and what the data can’t show
Where to find your average cost on Binance, Bybit and OKX (and how to revise it)
On Binance, your average cost sits in the wallet: Wallets → Overview → Crypto → tap the coin → Average Cost. Bybit shows Avg. Cost, and Spot Cost inside the Unified Trading Account. OKX calls the same idea Cost price.
| Exchange | What the screen calls it | Where to see it | Can you edit it? |
|---|---|---|---|
| Binance (wallet) | Average Cost | Wallets → Overview → Crypto → coin → Average Cost | Yes, with Revise. The old value is deleted for good. |
| Binance (chart) | Buy Average Price · Trade Analysis | Spot chart settings → Average Price | No edit option described. Counts buy orders from the past 365 days. |
| Bybit | Avg. Cost · Spot Cost | Assets overview · Spot screen → Assets | Spot Cost: yes, with the pencil icon |
| OKX | Cost price | Trade → Positions & assets → Cost price | Yes. Average or cumulative method in trade settings. |
To change it on Binance, open Average Cost and tap Revise. Adjust “Total investing funds” or “Average cost”, then tap Confirm. Read the warning first: “the previous average cost data will be deleted and cannot be restored”. Screenshot the current number first. It will be your only copy.
Can’t find Average Cost at all? Binance says the feature is “limited to selected users only”. Some accounts don’t have it. It also only uses data collected since August 1, 2021.
Binance itself calls the number “for reference only”. The average cost on an exchange screen is a guide only, and each exchange works it out its own way. For your real average buy price, use your own trade history and the calculator below.
Why your Binance average cost looks wrong
A strange Binance average cost almost always has a plain cause. Here are the usual ones, matched to the exchanges’ own help pages.
| What you see | Why it happens | Where to check |
|---|---|---|
| Coins you moved in show a strange average | Binance prices a deposit at the market price when it arrived. What you paid elsewhere is unknown to it. | Deposit history: the arrival date and the price that day |
| The wallet number and the chart line disagree | The wallet counts data since August 1, 2021. The chart line counts only buy orders from the past 365 days and skips deposits. | Compare the two screens, then their time windows |
| Your average dropped and you bought nothing | Binance’s PnL page counts Launchpool and airdrop coins at a cost of 0, Launchpad coins at the listing price. | Distribution or airdrop history |
| You sold some and the average stayed put (or moved) | Some screens keep the average after a sale. Others take the sale out and work it out again. | The cost method in your exchange settings |
| Your average is a little higher than your own math | Bybit’s Spot Cost takes the trading fee out of the coins you received. | Fee column in your trade history |
| Bybit shows “–” | Spot Cost resets when your balance or net buy quantity reaches zero. | Spot Cost under Assets |
The first cause is the big one. Buy a coin elsewhere at a high price and send it to Binance after a drop. Binance books it at the lower market price when it landed, not what you paid.
Selling is where exchanges split the most. Bybit says “Only an increase in quantity will affect the average cost”. OKX lets you choose. Its own example: buy 2 ETH at 3,000, then sell 1 at 3,500. The average method still shows 3,000. The cumulative method shows 2,500. Same coins, two costs, just from how the sale is counted.
Binance’s help page doesn’t say whether fees go into the wallet Average Cost. Bybit’s Spot Cost only counts trades since February 12, 2025, so older buys are missing there. Binance’s wallet page doesn’t list Earn rewards as a source. For rewards, see how unstaking works.
How to calculate your average buy price in crypto
Your average cost is the total money you spent divided by the total coins you received. Bigger buys count more, which is why people call it a weighted average. You will also see it called average buy price, average price or cost price, depending on the app.
| Buy | Price | Spent | Coins received |
|---|---|---|---|
| 1st | $100.00 | $100 | 1.0000 |
| 2nd | $80.00 | $100 | 1.2500 |
| 3rd | $64.00 | $100 | 1.5625 |
| Total | $300 | 3.8125 | |
| Weighted average (total spent ÷ coins) | $78.69 | ||
| Plain average of the three prices | $81.33 |
Fees left out to keep the arithmetic visible. Same money each time, so more coins arrive when the price is lower.
Three buys of $100 each, at $100, $80 and $64. The weighted average comes out at $78.69. Add up the three prices and divide by three, and you get $81.33. That shortcut only works if every buy got the same number of coins. The same money buys more coins at a lower price, so the low prices pull harder.
Don’t mix this up with the average fill price of one order. A big market order can fill at several prices, and the app averages that one order. Fills are covered in crypto order types.
Crypto average price calculator with fees and a target average
Type in your buys and the calculator gives your average buy price with fees, your break-even price, and what another buy would do.
- 1. Average buy price. Enter each buy price with the amount spent or the coins bought.
- 2. Averaging down. Enter the next buy price and amount to see the new average and the climb needed.
- 3. Target average. Enter the average you want and the buy price to see how much to add.
Fees go on top of the buy price. With a 0.1% fee, every dollar buys a little less coin. The break-even price then adds the selling fee: break-even = average ÷ (1 − fee). Once fees are counted, your break-even price sits a little above your average cost.
Take the same three buys at $100, $80 and $64 with a 0.1% fee. The average comes out at $78.77 and the break-even price at $78.85. Add $100 more at $51.20 and the average drops to $69.45 (−11.8%). To pull the first average down to $70 by buying at $51.20, you would need to add about $91.
Use one unit for everything: dollars, USDT or your own currency. Nothing you type is sent to our server. The math runs in your browser.
How averaging down moves your break-even price
Averaging down means buying more after the price drops, so your average price moves closer to the current price. It can never go below the price you buy at. The deeper the drop, the bigger the climb you need just to get back to even.
| Price fell by | Rise needed to get back to even | With one $100 buy at the top, then $100 more at the bottom: rise needed |
|---|---|---|
| −20% | +25% | +11% |
| −30% | +43% | +18% |
| −50% | +100% | +33% |
| −70% | +233% | +54% |
| −80% | +400% | +67% |
| −90% | +900% | +82% |
Arithmetic, not a forecast: rise needed = drop ÷ (1 − drop). Fees left out. In the third column the second $100 buys more coins at the low price, so the distance shrinks, but the money at stake doubles.
A 50% drop needs a 100% rise. A 90% drop needs 900%. You can’t move the price, but you can move your break-even price.
Back to the example. The price is now $51.20. If you had bought only once at $100, it would need to rise 96% to get you back to even. After the three buys, you need 54%. Add $100 more at $51.20 and you need 36%.
The distance shrank each time. The money at stake grew from $100 to $300 to $400. Averaging down lowers your average cost, but it also raises the amount of money you can lose. A lower average feels like a smaller loss. On the account screen it is a bigger position.
Dollar-cost averaging is different. You buy a fixed amount on a fixed schedule, whatever the price does. Averaging down is a choice you make after a drop. For the scheduled kind, see how to set up a recurring buy.
Averaging up means adding while the price rises, so your average climbs. Martingale doubles the amount after every drop. One long fall can wipe out the account.
Everything here is spot. With futures, averaging down also moves your liquidation price, so the math changes. See which leverage to use and why positions get liquidated.
Does averaging down crypto get you back to even sooner?
On past prices of coins that still trade, usually yes. Averaging down got back to even within a year far more often than holding. But the two break-evens are not the same size.
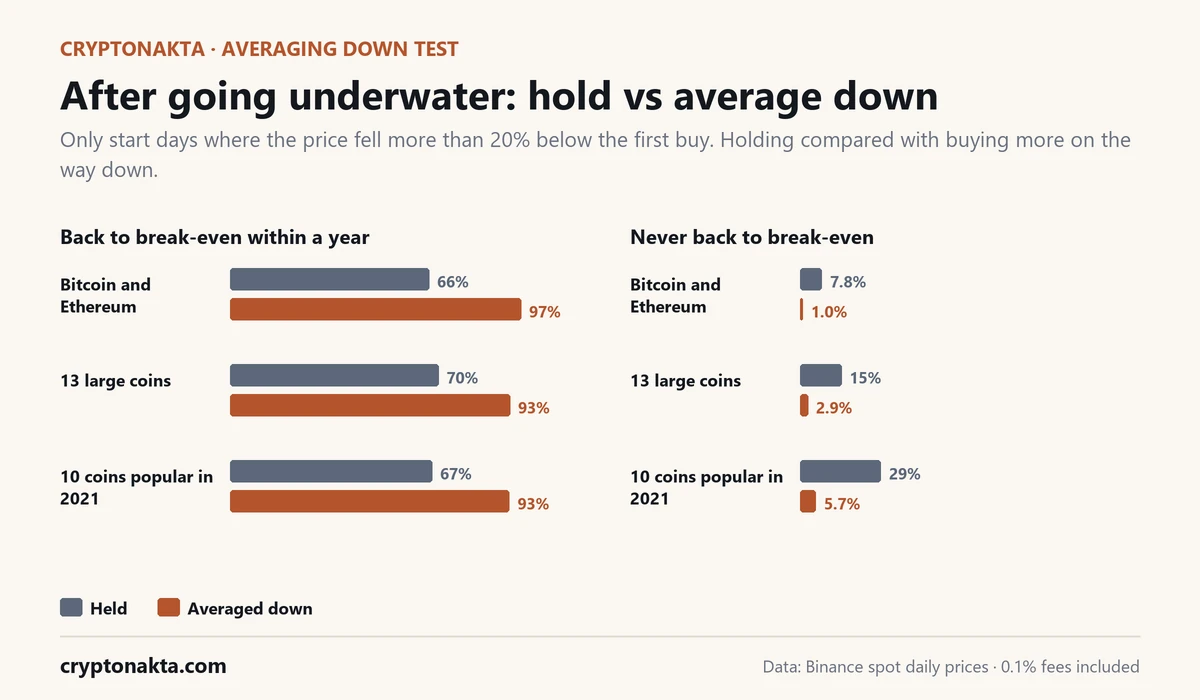
The rule, replayed on Binance daily prices: buy $100 at the day’s opening price. Each time the price falls 20% below the last buy, add another $100, up to 4 times. Fees are 0.1% per buy and per sale. We only kept start days where the price fell 20% within 90 days, and counted time from that fall.
That gave 31,451 start days across 25 coins. For Bitcoin and Ethereum, holding the first buy got back to even within a year in 66% of cases. Averaging down did it in 97%. For 10 coins popular in 2021, holding never got back to even in 29% of cases. With averaging down, that fell to 6%.
| Coins | Underwater start days | Back to break-even within a year: held / averaged down | Never back to break-even: held / averaged down | Left of the money when it never came back: held / averaged down |
|---|---|---|---|---|
| Bitcoin and Ethereum | 2,384 | 66% / 97% | 7.8% / 1.0% | 53% / 72% |
| 13 large coins | 16,045 | 70% / 93% | 14.9% / 2.9% | 22% / 42% |
| 10 coins popular in 2021 | 13,022 | 67% / 93% | 28.9% / 5.7% | 5% / 5% |
First buy $100 at the daily open; averaging down = another $100 each time the price is 20% under the last buy, up to 4 times ($500 total). Counted only on start days where the price fell 20% within 90 days; days are counted from the day of that 20% fall. Fees 0.1% per buy and sell. Start days overlap, so they are not independent trades.
Share this chart
Free to use on your site, blog or article with a credit link to CryptoNakta. Download image
Now the catch. Holding means your break-even is a $100 break-even. With averaging down it can be a $500 break-even. When the coin came back, the bigger position paid off. When it didn’t, more money was stuck. That is the next section.
When the price kept falling: all four extra buys used
When all four extra buys went in, the price had already fallen to about 41% of the first buy. That is where averaging down gets expensive.
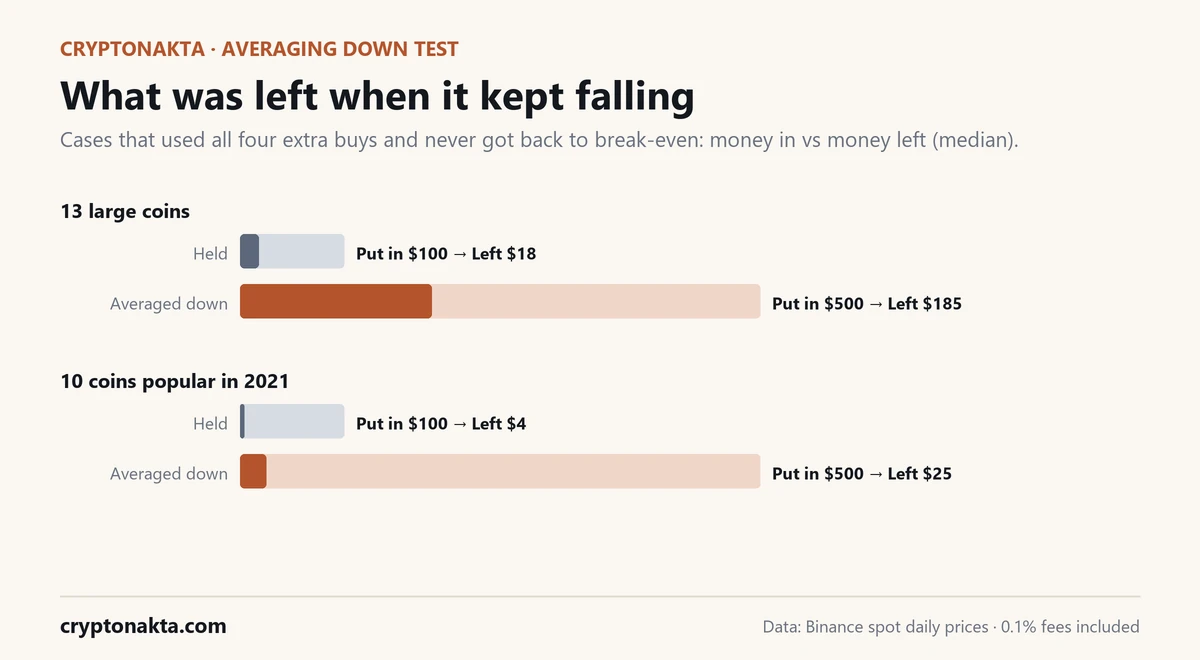
Among 10 coins popular in 2021, 13% of the cases used all four extra buys. Of those, 44% never got back to break-even. In the cases that never came back, the median one (half did better, half worse) had $25 left out of $500.
Holding just the first $100 failed in even more of these cases. Where it failed, the median amount left was about $4. So the typical loss was about $96 with holding and $475 with averaging down (medians of different cases). In coins that kept falling, averaging down multiplied the money lost several times over.
Bigger coins held up better. For 13 large coins, 25% of the all-four-buys cases never came back. For Bitcoin and Ethereum, it was 0.6%.
| Coins | Share of cases that used all 4 extra buys | Back to break-even within a year | Never back to break-even | Left of $500 (median, when it never came back) |
|---|---|---|---|---|
| Bitcoin and Ethereum | 8% | 74% | 0.6% | – |
| 13 large coins | 11% | 45% | 25.1% | $185 |
| 10 coins popular in 2021 | 13% | 47% | 43.6% | $25 |
All 4 extra buys used = the price fell to roughly 41% of the first buy (20% four times in a row). Rules: $100 first buy, $100 more at each 20% drop from the last buy, up to 4 times, 0.1% fees. The two medians come from different sets of cases (those that never came back when held, and those that never came back after averaging down).
“–” = fewer than 20 cases, too few for a median.
Share this chart
Free to use on your site, blog or article with a credit link to CryptoNakta. Download image
Two kinds of coins turn averaging down into pure extra spending. One is a token you can buy but not sell. See what a honeypot token is. The other is a coin heading for delisting, where trading simply stops. See what happens to delisted crypto.
Averaging down near a top: bitcoin, Ethereum, Solana and AXS
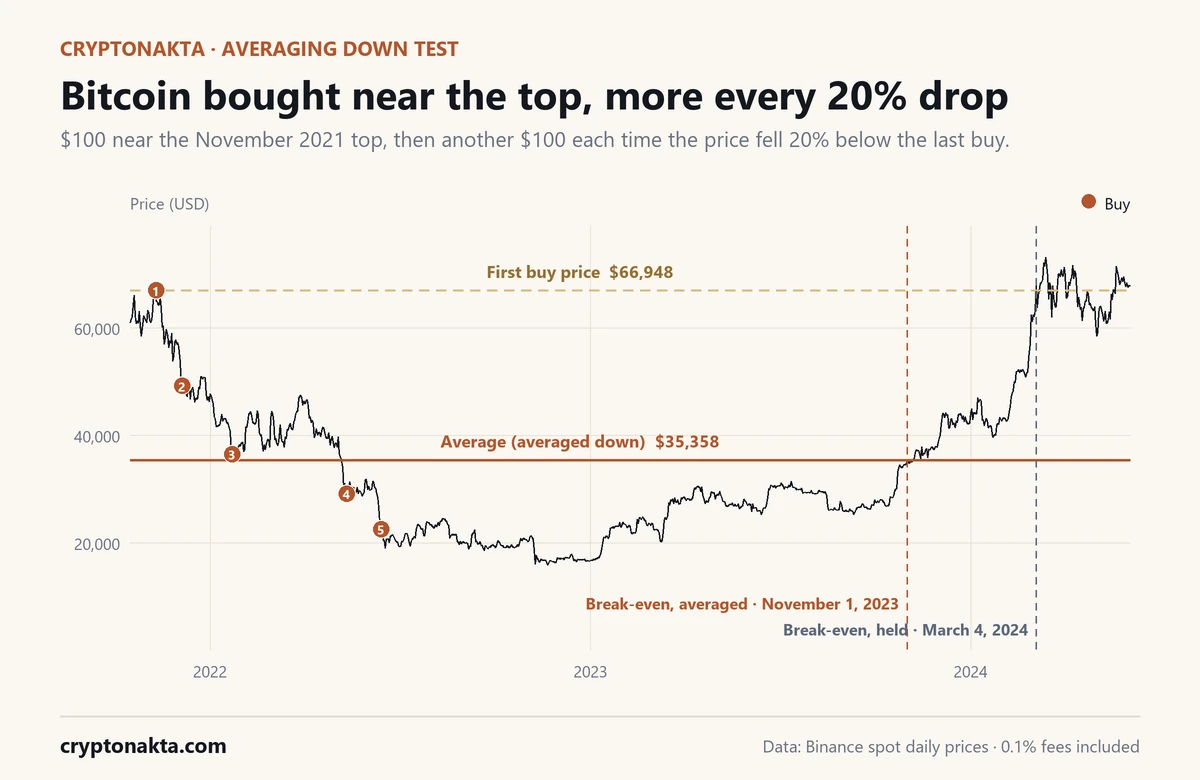
Started near big tops, the same rule ends very differently. In time order:
January 2018, bitcoin, just after the late 2017 run. The rule took four buys. The average got back to even on March 3, 2018, after a quick bounce. Holding the first buy waited until November 17, 2020.
November 2021, bitcoin again. The first buy was at $66,948 and the rule bought 5 times in total. Compared with the first buy, the average buy price moved −47%. That average got back to even on November 1, 2023. Holding got there on March 4, 2024.
Ethereum and Solana from the same weeks show a wider gap. Ethereum’s averaged position broke even on February 14, 2024, against August 13, 2025 for holding. Solana’s did on February 29, 2024, against November 17, 2024. Both later fell back below.
AXS, a game coin that was everywhere in 2021, is the other ending. The rule put in $500. The price never came back near the average. By the end of our data, it was worth about $4. Holding one $100 buy would have left about $1.
October 2025, bitcoin near a top again. The rule bought 3 times, starting at $123,482. The average sits at $92,865 and has not reached break-even yet.
| First buy | Coin | Buys | Average vs first price | Break-even, averaged down | Break-even, held | Left now: averaged / held |
|---|---|---|---|---|---|---|
| January 7, 2018 | BTC | 4 times | −34% | March 3, 2018 | November 17, 2020 | 574% / 380% |
| November 10, 2021 | BTC | 5 times | −47% | November 1, 2023 | March 4, 2024 | 184% / 97% |
| November 10, 2021 | ETH | 5 times | −42% | February 14, 2024 | August 13, 2025 | 67% / 39% |
| November 6, 2021 | SOL | 5 times | −48% | February 29, 2024 | November 17, 2024 | 61% / 32% |
| November 6, 2021 | AXS | 5 times | −42% | not yet | not yet | 1% / 1% |
| October 6, 2025 | BTC | 3 times | −25% | not yet | not yet | 70% / 53% |
Start on a day near a cycle top: $100, then $100 more at each 20% drop from the last buy, up to 4 times, 0.1% fees. “Left now” = value at the last daily close in our data as a share of the money put in.
Share this chart
Free to use on your site, blog or article with a credit link to CryptoNakta. Download image

Share this chart
Free to use on your site, blog or article with a credit link to CryptoNakta. Download image
Buy more every 10%, 20% or 30%? What the gap changes
A tighter gap buys sooner and runs out of money sooner. A wider gap buys less and waits longer. We reran the test with extra buys every 10%, 20% and 30% below the last one.
With a 10% gap, 32% of the 2021-coin cases used all four extra buys. With a 30% gap, only 10% did. A 10% gap means four buys after a fall of only about a third. After that you have nothing left for the rest of the drop.
| Buy more every | Coins | Back to break-even within a year | Never back | Used all 4 extra buys |
|---|---|---|---|---|
| 10% | Bitcoin and Ethereum | 90% | 3.1% | 36% |
| 10% | 10 coins popular in 2021 | 89% | 9.9% | 32% |
| 20% | Bitcoin and Ethereum | 97% | 1.0% | 8% |
| 20% | 10 coins popular in 2021 | 93% | 5.7% | 13% |
| 30% | Bitcoin and Ethereum | 93% | 3.9% | 6% |
| 30% | 10 coins popular in 2021 | 90% | 7.1% | 10% |
Only the gap between extra buys changes (10%, 20% or 30% under the last buy); everything else follows the main rules: $100 each time, up to 4 extra buys, 0.1% fees, counted from the day the price was 20% under the first buy.
The start year mattered more than the gap. For the 2021 coins, 10% of averaged-down starts from 2022 never got back to even. Starts from 2023 came in at 0%. Same rule, same coins, different market.
If you average down on spot, set these limits first
Set your limits before the next drop. Mid-drop is the worst time to decide.
- Set a ceiling. Pick the total amount and the number of extra buys now. Write them down.
- Check the coin first. Does it have a reason to still be around in a few years? Rule out common crypto scams.
- Decide your exit too. See how a stop-loss order works.
- Count fees. Every extra buy pays one. Check Binance fees and the cheapest ways to buy.
- Pick one plan. For steady buys whatever happens, a recurring buy is simpler.
- Stay on spot. Leverage adds a liquidation price. See spot vs futures.
For lower spot fees, here is Binance with our referral code.
Binance

Affiliate disclosure: some links are partner links. We may earn a commission at no extra cost to you. This is not investment advice.
CRYPTONAKTA
How we measured, and what the data can’t show
Everything comes from Binance spot daily candles against USDT, pulled from the public market-data API. We pulled them on November 18, 2026 03:25 UTC.
| Item | What we used |
|---|---|
| Prices | Binance spot daily candles against USDT (public market-data API) |
| Coins | 25 coins: BTC, ETH, BNB, XRP, SOL, ADA, DOGE, TRX, LTC, BCH, LINK, DOT, AVAX, XLM, ATOM, AXS, SAND, MANA, GALA, FIL, ICP, ALGO, THETA, CHZ, ENJ |
| Period | From each coin’s first daily candle to November 17, 2026 |
| Buy / break-even | Buy at the 00:00 UTC daily open · break-even judged on the daily close |
| Rules | $100 first buy · $100 more each 20% drop from the last buy · up to 4 times · 0.1% fee per buy and sell |
| Who counts | Start days with a 20% drop within 90 days; at least 365 days of data after the start |
| Left out | Coins no longer trading against USDT, or whose ticker moved to another coin |
| Measured | November 18, 2026 03:25 UTC |
We only counted coins that still trade today, so coins that died are missing and the results look better than reality. These are past results, and they do not predict what comes next.
More limits. Start days overlap, so one long fall shows up as many cases. We assumed a 0.1% fee, and yours may differ. Buys use the day’s opening price and break-even uses the closing price, so moves inside the day are ignored.
Two tickers were left out. LUNAUSDT joins the old LUNA (until May 13, 2022) and the new LUNA (from May 31, 2022). MATICUSDT ended on September 10, 2024 and carried on as POLUSDT. Measured as-is, both create fake jumps and gaps.
You can rebuild this yourself. Request daily candles from the Binance Spot API kline endpoint and apply the rule above.
Average cost and averaging down questions
- Binance: Spot API: Market data endpoints (Kline/Candlestick data) · checked November 18, 2026
- Binance: How to View or Reset the Average Cost in My Binance Wallet? · checked November 18, 2026
- Binance: How to Use Trade Analysis and Average Cost on Binance Spot? · checked November 18, 2026
- Binance: How to Calculate Token PNL on Binance Spot? · checked November 18, 2026
- Bybit: How to Understand Your Assets Overview and Average Cost · checked November 18, 2026
- Bybit: How to Calculate, View or Adjust Spot Cost in Unified Trading Account · checked November 18, 2026
- OKX: Updates to the spot cost price feature · checked November 18, 2026
- Binance Academy: What Is Dollar-Cost Averaging (DCA)? · checked November 18, 2026
Prices: Binance spot daily candles against USDT. Exchange screens and help pages can change. Past results are not a forecast. Nothing here is investment advice.