How to Read an Order Book: Depth, Spread and Slippage Explained
We read public order books line by line and added up the sell orders from the cheapest price upward. The coin decided the difference.
| What people ask | The short answer |
|---|---|
| What is the big number at the top of the screen? | The price of the last completed trade. It is a record, and it says nothing about the size of your fill. |
| So what decides the price I get? | The unfilled limit orders resting on the other side, taken from the cheapest line upward until your quantity is covered. |
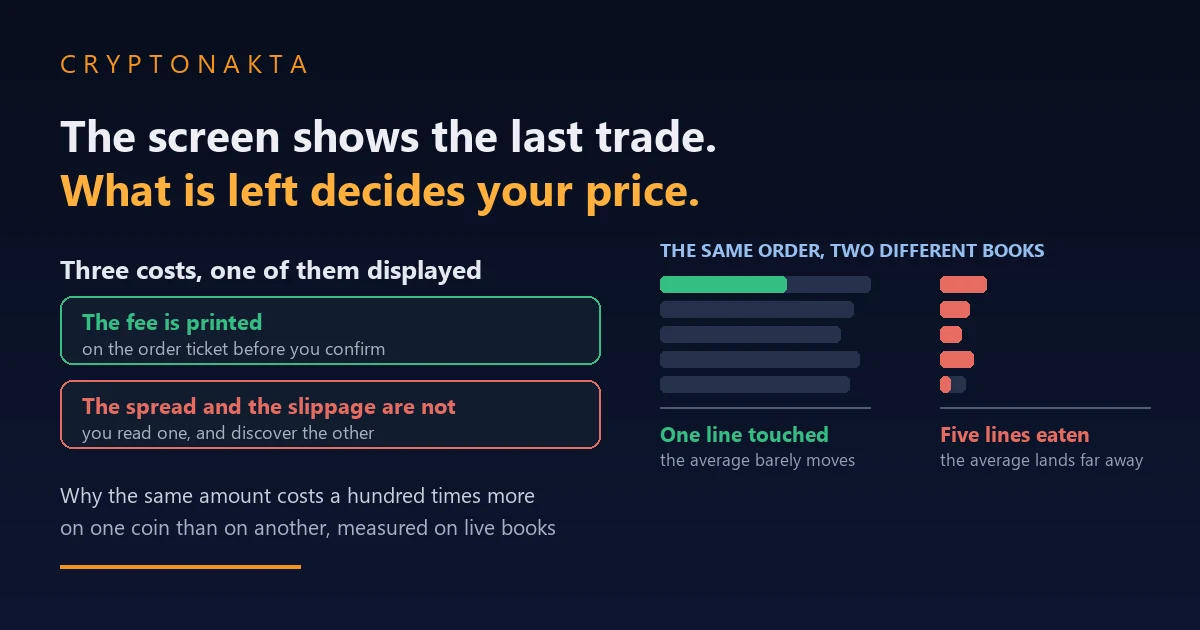
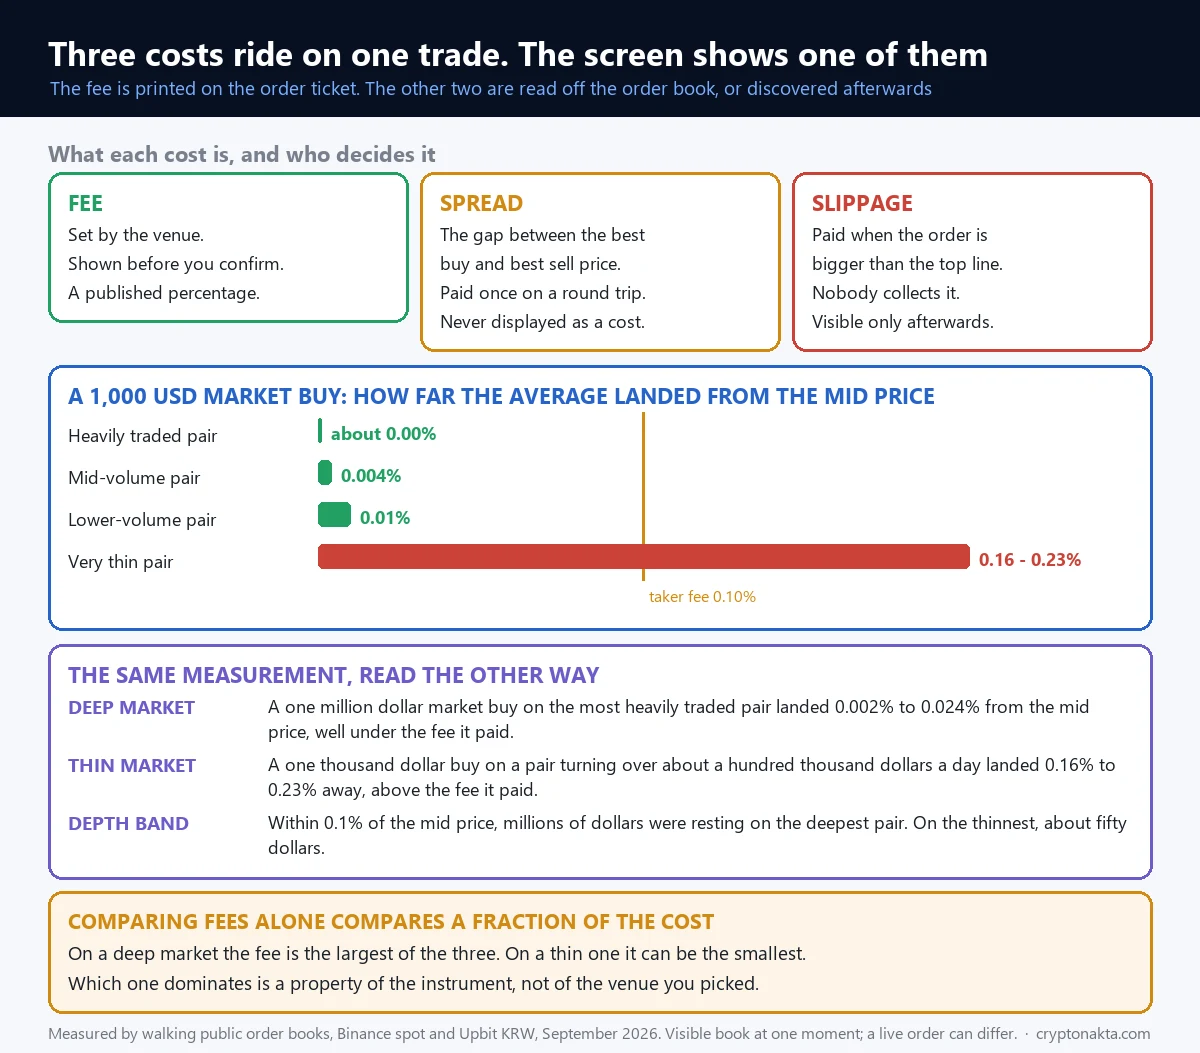
| How many costs are there? | Three: the fee, the gap between the best buy and best sell price, and the extra paid for going past the top line. Only the fee is printed. |
| What makes one trade cost more than another? | The coin, not the size of the order. We measured 0.024% on a million dollars in one and 0.23% on a thousand in another. |
| What can I check in ten seconds? | The distance between the top two prices, and whether the quantity on the top line covers what you want to trade. |
1. Two coins, one procedure: 0.024% on a million dollars, 0.23% on a thousand
2. The number on the screen already happened, and the list beside it holds no promises
3. One market buy, filled row by row, ends up as an average of several prices
4. How much is resting within a tenth of a percent of the mid price
5. The same amount of money in seven coins, measured in the same two minutes
6. Only one of the three costs appears before you confirm
7. The gap between the best buy price and the best sell price is paid on the round trip
8. The smallest price step a coin allows puts a floor under that gap
9. Why an order gets rejected: the five filters attached to each coin
10. The same coin on two exchanges, read at the same minute
11. A resting order stands in line: price first, then time
12. What the book cannot show, our own measurements included
13. Where to check every one of these on your own screen
14. My verdict on a screen that prints one cost out of three
15. The words used here, in plain terms
Press buy at market and two prices exist at the same moment. There is the number printed in large type at the top of the screen, and there is the price you actually end up paying. The first one is a record of a trade that already happened. The second one is decided by a list of orders resting on the other side of the market, waiting for someone to take them. This article is about that list: what it holds, what a market order does to it, and why the same amount of money can be a rounding error in one coin and a quarter of a percent in another. Every figure below comes from our own reading of public books at a stated time, or from exchange documentation.
1. Two coins, one procedure: 0.024% on a million dollars, 0.23% on a thousand
On 2 September 2026, between 04:44 and 04:46 UTC, we pulled public order books and worked out what a market buy of a fixed size would have averaged in each. No model was involved: we took the resting sell orders, started at the cheapest line, kept going up in price until the money was spent, and averaged the result. Three repeats per size. Two of those readings sit at opposite ends of the set.
One million dollars in the highest-volume coin we walked came out between 0.2 and 2.4 basis points away from the mid price, the halfway point between the best buy price and the best sell price. One basis point, usually written bp, is one hundredth of one percent, and 100 bp make 1%. So that range is 0.002% to 0.024%.
One thousand dollars in a coin whose 24-hour volume was in the hundred-thousand-dollar range came out between 16.2 and 22.7 bp, which is 0.16% to 0.23%.
Work both back into money. At 0.23%, a 1,000 dollar buy gave up about 2 dollars 30 cents against the mid price. At 0.024%, a 1,000,000 dollar buy gave up about 240 dollars. In cash the big order paid far more, as it should, being a thousand times larger. As a rate, which is what tells you the price of trading, the small order paid roughly ten times as much.
The cost comes from how much is resting at the top lines of the coin you picked. A thousand dollars is a rounding error in one book and a real push in another, at the very same minute.
2. The number on the screen already happened, and the list beside it holds no promises
Two different numbers live on the same trading screen, and confusing them is where most of the surprise comes from.
The first is the large price at the top, usually with a green or red arrow beside it. That is the last traded price: what one buyer and one seller matched at, a moment ago. It is history, nobody is obliged to trade with you there, and it says nothing about how much is available.
The second is the panel next to it, or behind a tab on a phone. That is the order book, a list of limit orders placed and not yet traded. Each row holds two things: a price, and the quantity still waiting at it.
How the two sides are arranged
Sell orders are sorted from the cheapest upward, since the cheapest offer is what a buyer reaches first. Buy orders are sorted from the highest downward. The cheapest sell price is the best ask. The highest buy price is the best bid. The distance between those two prices is the spread. Halfway between the two sits the mid price. Nobody is offering that price, and every fill in this article is measured against it.
The quantities are orders, not commitments
This is the part that gets skipped. Every quantity on that list belongs to someone who typed it in and can take it back, and any of those orders can be cancelled at any time before it trades. Each row tells you what is sitting there at that instant, and it can be gone by the time your order arrives.
The same goes for the big blocks people point at. A large order resting at one price does not mean that price will hold. Public data supports one statement only: at this moment, that quantity sits at that price. Why it was placed, whether it will be pulled a second later, whether the same person has orders elsewhere, none of that is visible, and we do not guess at it here.
3. One market buy, filled row by row, ends up as an average of several prices
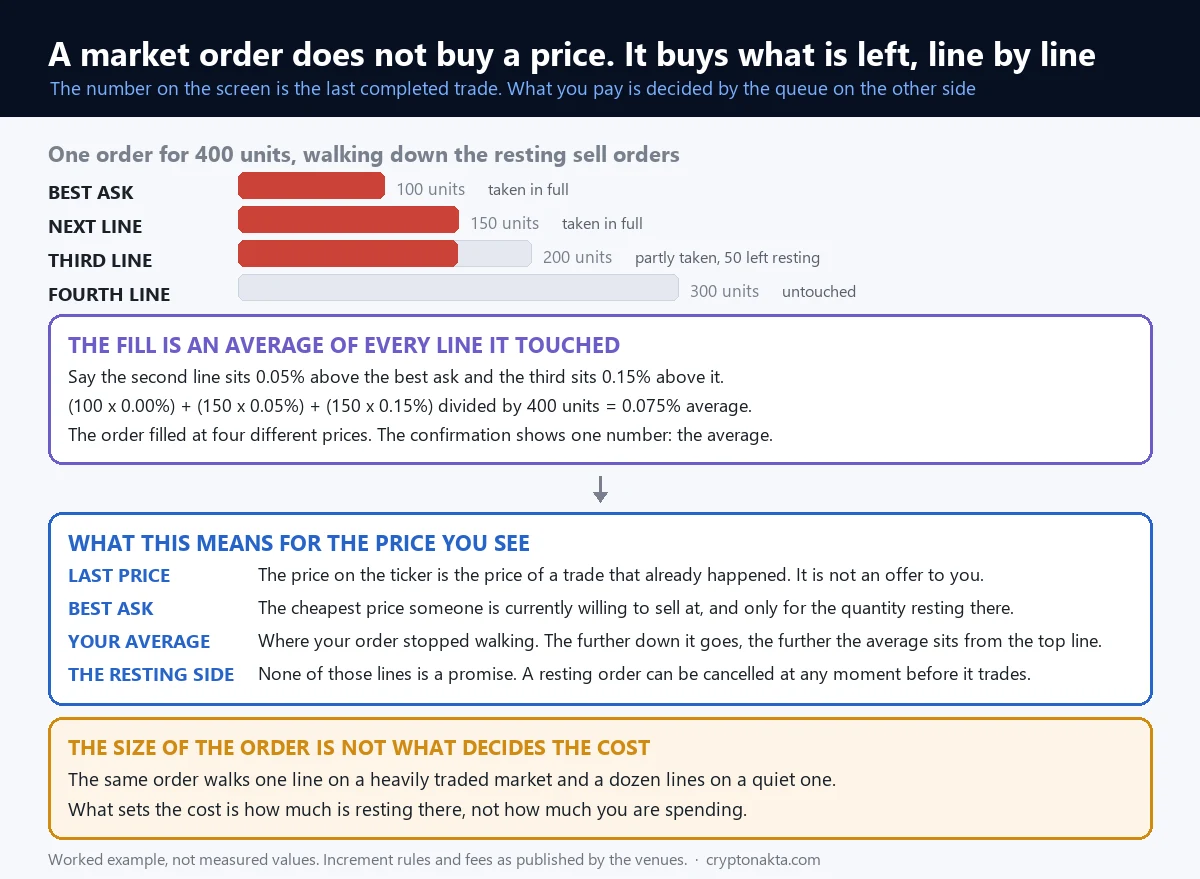
A market buy does not name a price. It says: take what is currently for sale, starting from the cheapest, until my quantity is covered. The engine does exactly that, in order, and reports the result back as one average. The steps never change:
- Take what rests on the cheapest sell line, up to the quantity you asked for.
- If the order is not covered yet, move to the next line up and take from there.
- Repeat until the quantity is filled.
- Add up what was paid at each line, divide by the total quantity, and that is your average fill price.
The arithmetic, done once
Say you want 10 units, and the sell side looks like this: 4 units at 100.00, then 3 units at 100.05, then 3 units at 100.20. The first four cost 400.00. The next three cost 300.15. The last three cost 300.60. Total 1,000.75 for 10 units, so the average price is 100.075.
You never traded at 100.075, and nobody offered that price. It is the weighted average of three lines. With the highest buy order at 99.98, the mid price before you pressed buy was 99.99, halfway between the two best prices. Your average landed 0.085% above that, which is 8.5 bp. On a 1,000 dollar order that is 85 cents; on a 100,000 dollar order the same 8.5 bp is 85 dollars.
Now change one thing. Keep the order at 10 units and put 40 units on the first line instead of 4. The whole order fills at 100.00 and the average is exactly the top price. The order did not change. The quantity resting on the other side did.
When the book runs out before your order does
If the quantity your order can reach is smaller than the quantity you asked for, you get a partial fill. Part of the order trades, and the remainder is handled by the rules of the order type you used. What limit and market orders are, and how each behaves when it cannot be completed, is a topic of its own, and our guide to crypto order types covers it.
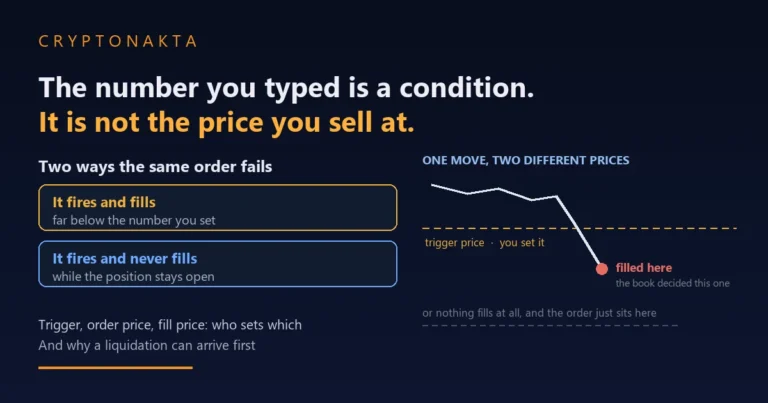
One connection belongs here. An order triggered by a condition, the kind covered in our stop-loss order guide, follows the same path. The trigger decides when the order is sent; once sent, it walks this same list at whatever prices are resting that instant.
4. How much is resting within a tenth of a percent of the mid price
People call coins deep or thin, which is a label. A measurement has a number in it: how much money rests between the mid price and a fixed distance from it?
We used a tenth of a percent, 0.1% or 10 bp, on either side of the mid. Adding up every resting order inside that band gives an amount in dollars, and that amount answers the question that matters before you press buy: does your order fit inside the band, or reach past it?
| Pair | Resting on the sell side within 0.1% | Resting on the buy side within 0.1% | What that amount tells you |
|---|---|---|---|
| BTCUSDT | 7.44 million dollars | 6.27 million dollars | An order below that size is covered without leaving the band |
| HBARUSDT | about 7,900 dollars | about 11,300 dollars | A 10,000 dollar buy already reaches past the band |
| CTSIUSDT | about 50 dollars | about 50 dollars | Fifty dollars is enough to reach past the band |
Binance spot, read at 04:44 to 04:46 UTC on 2 September 2026.
The same band, amounts a hundred thousand times apart
The band is identical in all three rows. Only the contents change, by a factor of roughly a hundred thousand between the first row and the third, which is the number behind the word thin. Widen it to a full 1% and the first row holds 17.10 million dollars to buy from and 21.52 million to sell into, while the third row reaches only about 10,660 and 15,070 dollars.
The rule, apart from the numbers
An order smaller than the amount resting inside the band finishes inside the band. An order larger than it does not, and the excess fills at prices outside it. That sentence stays true whatever the amounts read next month.
For example, a 10,000 dollar buy in the second row takes the roughly 7,900 dollars available inside 0.1% and keeps going past it. That outcome is what the arithmetic said before the order was sent, and the same subtraction runs on any coin.
5. The same amount of money in seven coins, measured in the same two minutes
Same procedure, same two minutes, seven coins, four order sizes. Every cell is how far the average fill landed from the mid price, in bp, where 100 bp are 1%. Ranges show the variation across three repeats.
| Pair (24h volume) | 1,000 dollars | 10,000 dollars | 100,000 dollars | 1,000,000 dollars |
|---|---|---|---|---|
| BTCUSDT (1,098M) | 0.0 | 0.0 | 0.0 to 0.6 | 0.2 to 2.4 |
| ETHUSDT (712M) | 0.0 | 0.0 | 0.6 to 1.2 | 3.8 to 4.2 |
| XRPUSDT (163M) | 0.4 | 0.4 | 3.7 to 4.8 | 25.8 to 26.8 |
| LTCUSDT (17.8M) | 1.0 | 2.3 to 5.4 | 12.6 to 14.9 | 329 to 334 |
| HBARUSDT (6.3M) | 0.7 to 1.0 | 6.1 to 7.7 | 25.4 | 531 to 536 |
| CTSIUSDT (0.1M) | 16.2 to 22.7 | 45.2 to 46.4 | 2,064 to 2,080 | 38,969 to 39,034 |
| XVSUSDT (0.1M) | 16.4 | 75.9 to 79.7 | 2,864 to 2,874 | 18,904 to 18,916 |
Binance spot, market buy, walked line by line on the visible book. 2 September 2026, 04:44 to 04:46 UTC, three repeats. The bracketed figure is the 24-hour quote volume at that moment. The two bottom cells in the last column, roughly 390% and 189%, are arithmetic on the visible book. An order that size would meet the bound the exchange puts on the order price first, a buy-side multiple of 1.2 at the time of our query.
Read it down, then read it across
Read a row downward and you get the obvious part: inside one coin a bigger order costs more, since it reaches higher prices on the list. Read a column across and you get the part that surprises people. At 1,000 dollars the top two rows come out at zero and the bottom two do not, and that is the same money on the same exchange in the same minute.
Hold that against a fee. Binance charges 0.100% on spot at the standard level, which is 10 bp. On the top row, a million dollars cost between a fiftieth and a quarter of that fee. On the bottom rows, a thousand dollars cost about twice it. The relationship between the printed cost and the unprinted one turns over completely, and nothing on the order screen says which side of it you are on.
The volume figures in the first column are a reading of that moment too, so treat them as context, since the ranking moves. One coin above, Hedera, has its own profile here; it appears purely as a depth example.
6. Only one of the three costs appears before you confirm
Three separate costs attach to one trade. They come from different places, behave differently, and the order screen shows exactly one of them.
| Cost | Printed on the order screen? | Set by | Gets larger when |
|---|---|---|---|
| Fee | Yes, as a rate, before you confirm | The exchange’s published schedule and your tier | Your tier or your discount changes |
| Spread | No, you read it off the book yourself | The coin’s minimum price step and the orders resting now | One price step is a large share of the price |
| Slippage | No, it appears afterwards in the average fill price | Your quantity against the quantity resting | Your order passes the quantity on the top lines |
The fee
Published and predictable. Binance lists 0.100% on spot at the standard level, whether you place an order or take one, and 0.075% when the fee is paid in BNB. Upbit’s won market, which we also measured, charges 0.05%. Whatever the number is where you trade, it sits on the fee page and on the order screen before you confirm, and that is why everybody compares it.
The spread
The exchange does not charge the gap between the best bid and the best ask. That gap is the distance between what the highest bidder offers and what the cheapest seller asks. You meet it because a market buy trades against the ask while a market sell trades against the bid, and what you pay across it goes to the traders whose orders were sitting there.
The slippage
The exchange does not collect this one either. It is the arithmetic difference between the average price your order produced and the mid price before you sent it. Every unit was paid to a person whose resting order you took, at the price that person asked for. The order simply reached past the first line.
Which of the three dominates is set by the coin. In the top rows of our measurement the fee is nearly the whole cost, while in the bottom rows it is the small part. Neither case is a defect. It is one mechanism producing different numbers because different amounts are resting.
7. The gap between the best buy price and the best sell price is paid on the round trip
The gap between the two best prices has a property that makes it easy to underestimate: you pay it once per round trip, not once per lifetime of holding.
Buy at the best ask, then sell straight back at the best bid, with nothing moving in between. You are down by the gap. No price change was needed, no fee schedule was involved. The spread is a cost you pay once on a round trip, and it goes to the traders on the other side of each leg.
What we measured
On Upbit’s won market, read on 2 September 2026, the gap between the top two prices was 0.28 bp on its biggest pair, which is 0.0028%. On another it ran between 17 and 35 bp, or 0.17% to 0.35%. On a third it was 98.5 bp, about 0.99%.
The fee on that market is 0.05%. Put both on a 1,000 dollar round trip. The fee costs 50 cents going in and 50 cents coming out, a dollar in total. The 0.99% gap costs about 9 dollars 85 cents on that same round trip. Only the dollar of fees was printed on the order screen before either leg was sent.
When one round trip becomes many
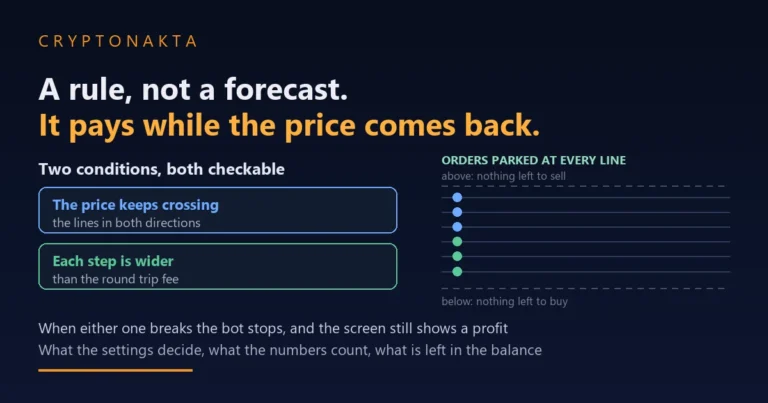
Anything that trades often meets the round trip repeatedly. A grid places buy and sell orders at set intervals and collects the difference between them. If the interval between two steps is narrower than the fee paid on both sides plus the gap it has to clear once, that step is negative before the market does anything. For example, at the 0.05% fee above, a round trip pays 0.10% in fees. Add the 0.17% gap measured earlier and a step has to clear 0.27% before it leaves anything. We work through the mechanics in the grid trading bot guide, and the number to compare spacing against is that total, not the fee alone.
8. The smallest price step a coin allows puts a floor under that gap
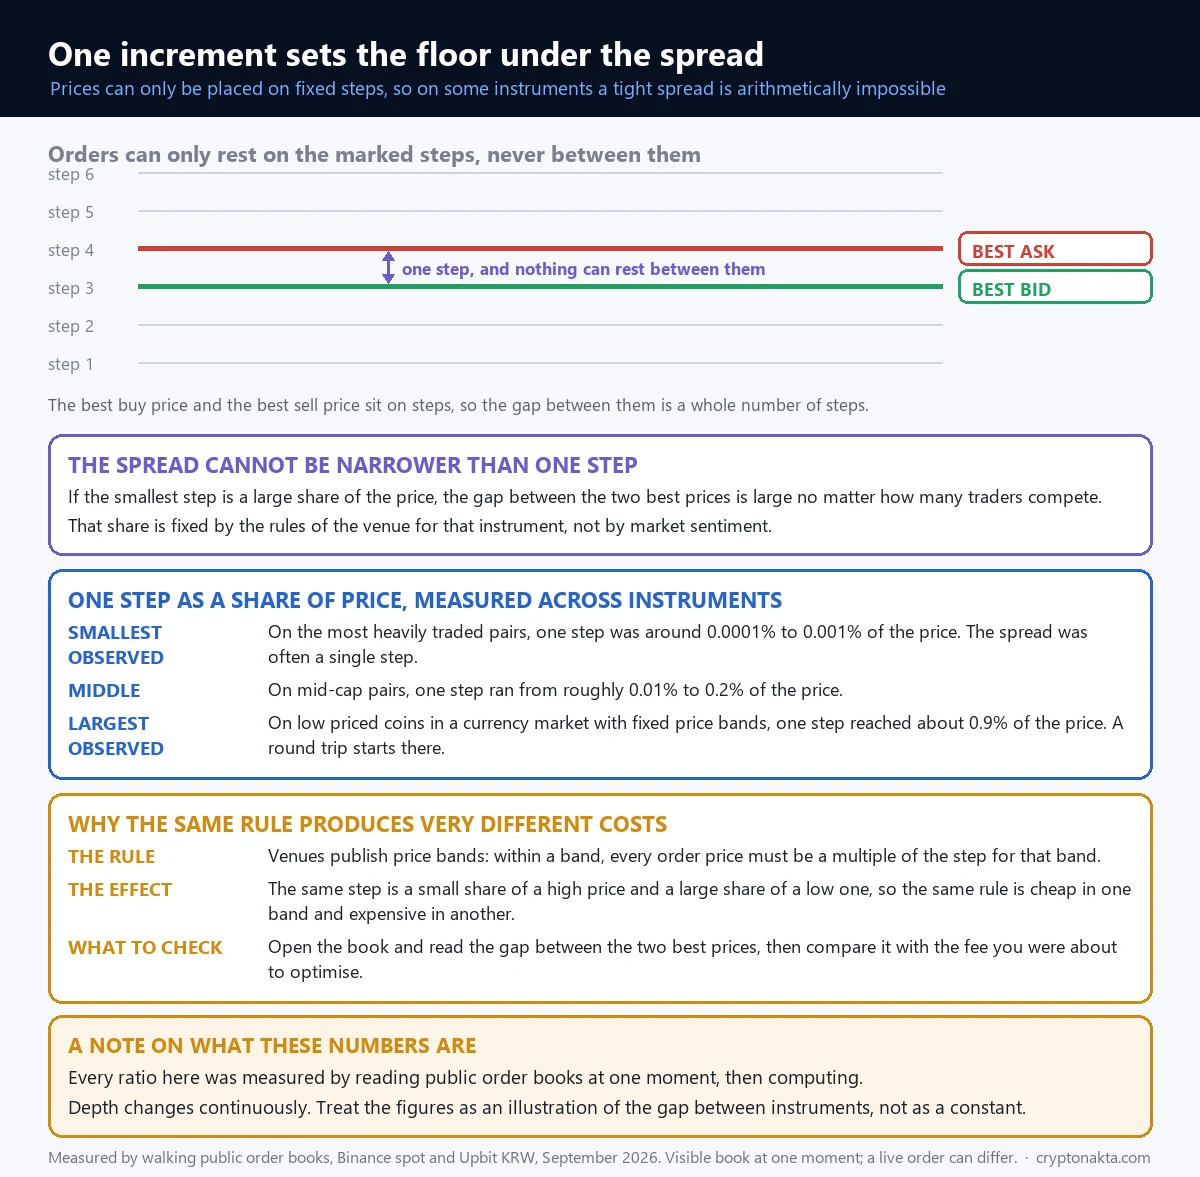
The spread cannot go below one price step, so that step is the narrowest gap the coin allows.
Every pair has a minimum price increment, usually called the tick size, and your order price has to sit on an exact multiple of it. Binance states it plainly in its filter documentation: “tickSize defines the intervals that a price/stopPrice can be increased/decreased by”, with the condition that price % tickSize equals zero. With an increment of 0.01, then, 12.34 is accepted and 12.345 is not.
The consequence follows at once. Best bid and best ask cannot sit closer together than one increment. On a coin where one step is already 1% of the price, the gap cannot be narrower than 1%, however many people are competing to quote it.
| Market | Where one step is smallest | In between | Where one step is largest |
|---|---|---|---|
| Upbit won market | BTC pair, 0.09 bp | XRP pair 5.4 bp, BONK pair 17.4 bp | SC pair 89.7 bp, about 0.9% |
| Binance USDT market | BTCUSDT, 0.001 bp | HBARUSDT 1.35 bp, BCHUSDT 4.01 bp | XVSUSDT 32.68 bp, about 0.33% |
Observed price increments as a share of price, measured 2 September 2026. Inside a single exchange the share differs between coins by more than ten thousand times.
Steps that change with the price band
Some exchanges do not give each coin its own increment. They publish one table of price bands and apply it to everything quoted in that currency. Upbit does exactly that for its won market. It sets 1,000 won steps above 2,000,000 won, 100 won steps from 100,000 to 499,999, 10 won from 10,000 to 49,999, 1 won from 1,000 to 4,999 and again from 100 to 999, 0.1 won from 10 to 99, and it keeps stepping down from there. The minimum order on that market is 5,000 won.
Run the arithmetic across a band boundary and the differences stop being mysterious. One won is 0.02% of a price of 4,999. The same one won is 1% of a price of 100. Identical rule, identical step, and a fifty-fold difference in what crossing it costs, decided by nothing except which band the coin trades in.
So the rule worth keeping is this: the floor under the spread is the share of the price that one step takes up. When the tables change, recompute the share and the conclusion follows.
9. Why an order gets rejected: the five filters attached to each coin
Most rejected orders are not mysterious. Each coin carries a small set of filters, and the message you get is one of them saying no. We queried Binance’s public rules for eight coins on 2 September 2026, and these five cover nearly everything people run into.
| What you see | What it hit | What to check |
|---|---|---|
| The price field refuses your value | Not a multiple of the price step | Every coin has its own step, often coarser than expected |
| The quantity field refuses your value | Not a multiple of the quantity step | Some coins take whole units only |
| Rejected as too small | Below the minimum order value | 5 USDT on all eight coins queried; 5,000 won on Upbit |
| A big market order is refused, a limit order of that size is not | The market-order size cap | Set separately from the limit cap, and revised on a schedule |
| Rejected as out of range | Bounds on the order price | Buy-side multiple 1.2, sell-side 0.8, at the time of the query |
The two step filters, and the minimum
The price step is the one the section above worked through, the smallest amount the price may move by on that coin. The quantity step applies the same idea to the quantity: it has to be an exact multiple of a per-coin increment. HBARUSDT and CTSIUSDT both had a quantity step of 1 in our query, so fractional quantities were refused outright there, while BTCUSDT had 0.00001. The minimum order value applies to the money, not the number of units: 5 USDT on all eight coins, 5,000 won on Upbit.
Two different caps, and a bound on the price
The caps come in pairs and they are not equal. On Bybit’s spot BTCUSDT, a single limit order could be 230 BTC while a single market order could be 120 BTC. On Binance, the market-order cap read 142.09 BTC when we queried it. Bybit’s documentation states these caps are revised on the third and the seventeenth of each month at 08:00 UTC+8, so any figure here is a reading, not a constant to memorise.
The last filter puts an upper and a lower bound on the price an order may name, and on all eight coins the buy-side multiple was 1.2 and the sell-side 0.8 at the time of the query. The documentation defines those bounds on the order price, and that is as far as we take it; how the filter treats an order that names no price is not spelled out publicly.
10. The same coin on two exchanges, read at the same minute
The same asset trades on many exchanges, and each keeps its own book with its own participants. There is no shared list. Prices track each other because people trade across them, but at any instant the two books are different objects. We read two of them in the same minute and walked both with the same sizes.
- One million dollars into BTCUSDT: 0.2 bp on Binance, 4.5 bp on Bybit, which is 0.002% against 0.045%.
- One hundred thousand dollars into HBARUSDT: 25.4 bp on Binance, 35.8 bp on Bybit, or 0.25% against 0.36%.
- One million dollars into HBARUSDT: 531 bp on Binance. Bybit’s public feed returns 200 levels, and the order was not covered inside them, so there is no figure to report.
What this is not
It is not a ranking. A reading at 04:45 UTC on one day, in two coins, cannot say which exchange holds more at any other moment. Repeat it in another hour or another coin and the order can reverse. The third bullet needs the same care: it describes the limit of a data feed, not of a market. A feed that returns 200 levels shows 200 levels, and what lies beyond them is invisible to us, so it stays out of our arithmetic.
What it is useful for
It shows the question has to be asked per exchange, per coin, per moment, on your own screen. Two accounts can produce two different fills for the same order at the same second, and neither is malfunctioning. Our exchange comparison covers the parts stable enough to compare, such as published fees and supported markets. Depth is not one of them.
11. A resting order stands in line: price first, then time
An order resting on the book does something different from an order consuming it. The first makes a price available, the second takes one that is already there, and that is where the words maker and taker come from.
Resting orders are served in a strict sequence. Price comes first: a buy at a higher price is reached before a buy at a lower one. Time comes second: among orders at the same price, the earlier one trades first. That is price-time priority, and it explains how two orders at an identical price end up with completely different outcomes.
One concrete difference you can check
Suppose you have a limit buy resting at a price, with other people’s orders ahead of you at that same price. Two ways of changing it give two different results. Cancel it and place a new one at the same price, and the new order takes a new timestamp. Binance states the consequence directly: it executes after the orders already resting at that price. Now reduce only the quantity instead, using the amend function built for that. The order keeps its identifier and its place, and the documentation describes the quantity changing while queue priority is preserved. Raising the quantity or moving the price does not qualify, because both change what the order asks for.
| Item | Market order | Limit order |
|---|---|---|
| Execution | Now, if quantity is resting | Not guaranteed |
| Price | Not guaranteed, arrives as an average | Never worse than the price you typed |
| What you give up | The gap, the extra paid past the top line, the taker fee | Time, and the chance it never trades |
| Queue | None, it takes what rests | Price first, then time |
| Maximum per order | Can be capped lower | Can be capped higher |
Both columns carry a cost, and they are different costs. A limit order may not fill at all, and while it waits the price can leave the level and never come back. A market order removes that uncertainty and pays the gap and the extra past the top line for it. Anyone presenting one of them as correct for every situation is skipping the trade-off that defines them.
What splitting an order actually changes
One large order takes more from each line at that instant. Several smaller ones take less each time and let the market move in between, in either direction. Splitting trades the cost of one big order for the risk that the price moves while you wait, and it does not touch the resting quantity that sets the cost. We publish no recommended number of pieces, having measured none. Scheduled buying spread over time runs on the same trade-off, and the mechanics are in our recurring buy guide.
12. What the book cannot show, our own measurements included
Everything above rests on a public order book, and a public book has limits we should state ourselves.
The feed returns a fixed number of levels
Public endpoints do not hand over an unlimited list. The ones we used return 30 levels on Upbit, 200 on Bybit, and up to 5,000 on Binance, and our arithmetic used only what came back. When we say an order could not be covered, it means it could not be covered inside the levels the feed returned. That says something about the feed, not about the market.
The book changes while you look at it
Orders are cancelled and modified constantly. The book we read at 04:45 was already a different book at 04:46, so every measurement was repeated three times and published as a range. Each number here is a snapshot of one second. When a real order goes in, other trades and new orders arrive between your click and your fill, so a real average can land on either side of our arithmetic.
What is displayed is what is displayed
A public book shows the resting orders it displays. Whether quantity exists that is not displayed cannot be confirmed or denied from public data, so we claim nothing either way. Read every number here as what the visible book held at that timestamp, and what walking it would have produced.
| What people expect | What the data actually supports |
|---|---|
| A big block at one price defends that level | It can be withdrawn any time before it trades, and its purpose is not visible |
| The lowest fee means the lowest total cost | On thin coins the two unprinted costs can exceed the printed one |
| A small order avoids slippage | The deciding number is not the size you send, it is the depth resting on the other side |
| The book shows the whole market | Feeds return a limited number of levels, and contents change between reads |
| A measured figure is a property of the coin | It is a property of one book, at one moment, on one exchange |
That does not make the measurements useless: they are arithmetic on a visible list at a stated time, good for the rules they demonstrate.
13. Where to check every one of these on your own screen
Every quantity in this article can be checked on the coin you actually trade, in about a minute. Screens differ between exchanges and get redesigned, so this is written in general terms rather than by button name.
- Open the book panel. Two columns: price, and the quantity still resting there. On a phone it is usually behind a tab next to the chart.
- Take the two prices nearest the middle. Subtract, divide by the mid, multiply by 100, and you have the gap as a percentage. Every round trip pays it.
- Compare the top line to your order. If the quantity on the first line covers what you want, the visible book says your order ends on that line. If it does not, you can read in advance which lines it would reach.
- Note the fee rate on the order screen. That is the one cost printed for you, and it is one of three.
- Test the increments by typing. Add a decimal place to the price, then to the quantity, and see what the field accepts.
- After the fill, open your order history. Compare the average fill price recorded there with the mid price you saw before sending the order. That difference is the slippage you paid, and it is the only place it is written down.
Two things that change what you are looking at
Spot and derivatives are separate markets with separate books for the same asset, and one order size can meet very different depth in each; our explainer on spot versus futures sets that out. And which coins and markets appear on your screen depends on where you are and on what each exchange has chosen to list, so check your own screen before assuming a market exists because an article mentions it.
Where to look at an actual book
These exchanges publish order books and per-coin rules, so the checks above run on any of them. The codes below are our referral codes.
Binance

Bybit

Gate.io

KuCoin

Affiliate disclosure: some links are partner links. We may earn a commission at no extra cost to you. This is not investment advice.
14. My verdict on a screen that prints one cost out of three
I walked several thousand book levels for this article, and here is where I land, with the reasoning attached so you can argue with that instead of the conclusion.
The result I did not expect to be so stark
The ordering of costs followed the coin rather than the size of the order. Read the measurement table across any single row of sizes and the reversal shows up again, on one exchange in the same two minutes. So a rule of thumb built on how much you are sending is built on the wrong variable.
Who this actually affects
Someone trading a high-volume coin in ordinary retail size pays the fee and little else, and for that case the fee page is a fair summary. Someone trading a low-volume coin gets a fee page describing a small part of what they pay, with the larger part shown nowhere beforehand. The screen is equally uninformative in both cases.
The part I find hardest to defend
An order screen displays the fee to two decimal places and displays neither the gap nor the extra paid past the top line, though both are computable from data the exchange already streams to your browser. I will not speculate about why; motives are not observable. The consequence is observable enough. People compare exchanges on the single number that is printed, and on a thin coin that number is the one least likely to decide what they pay.
Where the opposite view holds up
There is a real argument on the other side. The gap between the top two prices and the extra paid past the first line both move as the book moves. A figure shown before you confirm would be an estimate, and it could be wrong by the time the order lands. An estimate carrying the authority of a fee misleads in its own way. Paying for certainty is a fair trade too: a market order buys immediate execution, and in the deep rows above it cost less than the fee charged for it. My view is that the screen should show more, not that one order type beats another.
15. The words used here, in plain terms
The terms above, in the sense used on this page, each with a one-line example.
Order book. The list of limit orders placed and not yet traded, one row per price. Example: a row reading 100.05 with 3 units means three units wait at that price.
Best bid and best ask. The highest price anyone offers to buy at, and the lowest price anyone offers to sell at. Example: a market buy takes the 100.00 line before touching 100.05.
Mid price. The halfway point between the two. Example: with 99.98 and 100.00 on screen the mid is 99.99, and nobody trades there.
Spread. The distance between best bid and best ask, paid once on a round trip. Example: under a hundredth of a percent on one coin and about 1% on another.
Slippage. The difference between the average price your order produced and the mid price before you sent it. Example: an average of 100.075 against a mid price of 99.99 is 8.5 bp, or 0.085%.
Depth. How much rests inside a stated distance from the mid. Example: inside the same 0.1% band, one coin can hold millions of dollars and another only tens.
Price step and quantity step. The smallest amounts by which an order price and an order quantity may change. Example: with a price step of 0.01 you can type 12.34 but not 12.345; with a quantity step of 1, an order for 1.5 units is refused.
Price-time priority. Better prices first, and among equal prices the earlier order first. Example: cancelling and re-entering at the same price puts you behind everyone already resting there.
Maker and taker. An order that rests and waits is making; an order that consumes what rests is taking. Example: a market buy is always taking, so taker fees apply to it.
Questions readers ask about order books, depth and slippage
Read next: how the exchanges compare on fees, markets and account rules