Grid trading bots: the APR on the screen is the run so far, multiplied out to a year
What the rule actually does, the two conditions that make it pay, and what happens to the balance when either one breaks.
| Question | Short answer |
|---|---|
| What does a grid bot actually do? | Places limit orders at preset price levels, and posts the opposite order one level away whenever one fills. There is no forecasting component. |
| When does the rule pay? | Only when price travels back and forth inside the range, and when one grid step is wider than the round-trip fee. |
| Where is the fee threshold? | (1 + c) ÷ (1 − c): about 0.2002% per step at a 0.1% fee, about 0.1501% at 0.075%. |
| What happens outside the range? | Above it, everything is sold and none of the further rise is captured. Below it, everything is bought and the unrealised loss is carried in full. |
| Why is Grid Profit still positive then? | It only counts completed pairs. The loss on unmatched holdings sits in Total P&L. |
| Is the annualised figure a yearly return? | No. It is the run so far multiplied out to 365 days; Bybit’s example (23,610 USDT, five grids, one day assumed) prints 528.42%. |
| What does the futures version add? | Funding every interval, liquidation at a 100% maintenance margin rate, and an open position that survives leaving the range. |
1. Where the annualised figure comes from: one day of profit, multiplied by 365
2. Grid Profit, fees, Grid APR, Total P&L: four labels counting four different things
3. There is no judgement inside the bot, only a rule about where orders sit
4. Four settings, and every other number follows by arithmetic
5. Arithmetic spacing and geometric spacing pay differently per grid
6. One grid step has to be wider than the round-trip fee
7. Why a narrow range allows fewer grids, and where the platform ceilings sit
8. The moment price leaves the range: all quote asset, or all coin
9. Trailing up raises the top of the range, and the bottom rises with it
10. What the automatic parameter suggestions are calculated from
11. The futures version adds liquidation and funding to the same rule
12. Eight claims about grid bots, set against what the documentation says
13. The numbers to check on your own account before any of this applies
14. The words on the bot screen, in plain terms
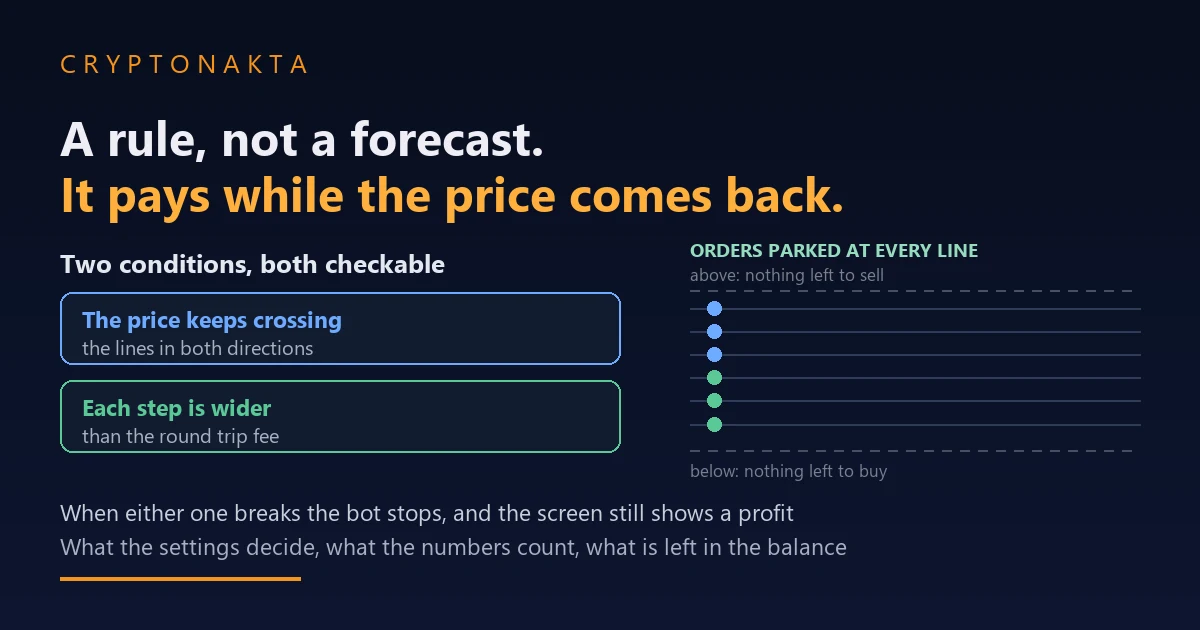
A grid bot runs one rule: orders rest at fixed price levels, and whenever one fills, the opposite order posts one level away. No part of it forecasts anything. The rule pays under two conditions and stops paying when either breaks, while the profit figures on the panel go on counting the same way in both situations. The annualised percentage that leads most grid screenshots is one day of realised profit multiplied by 365, and the exchange publishes the calculation.
1. Where the annualised figure comes from: one day of profit, multiplied by 365
Grid bot screenshots usually lead with the annualised percentage, and it is often in the hundreds. Bybit publishes the calculation that produces that number, so the figure can be checked against its own formula.
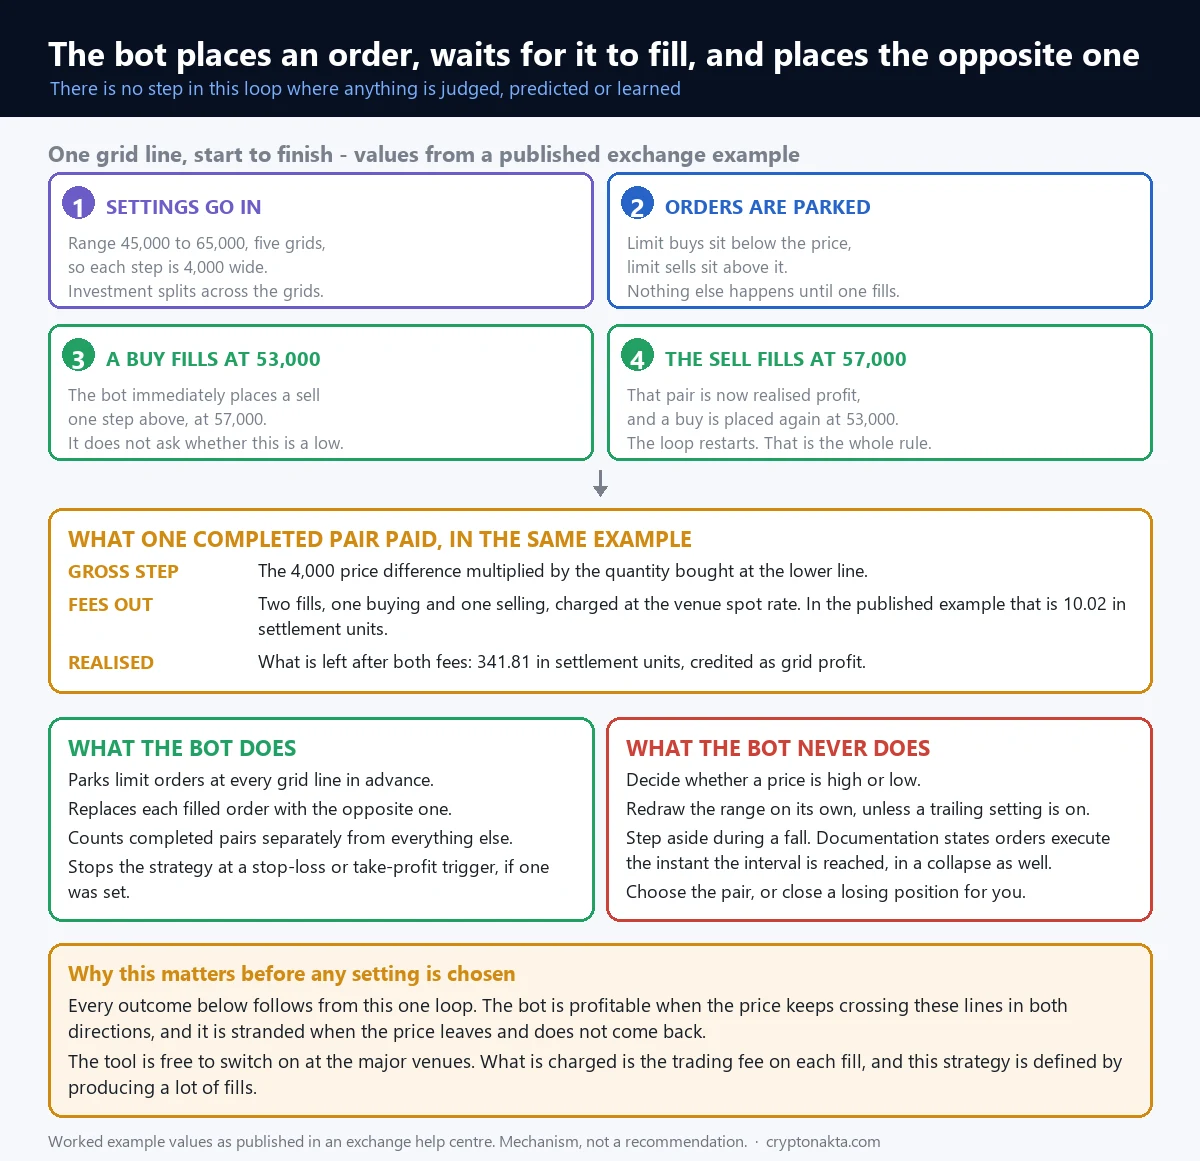
Bybit’s help centre carries a full worked example for its spot grid bot. The settings are BTC/USDT with the market at 54,000 USDT, an upper bound of 65,000, a lower bound of 45,000, five grids, and a total investment of 23,610 USDT. Take 65,000 minus 45,000, divide by five grids, and each line sits 4,000 USDT from the next.
One complete round trip happens. The bot buys 0.08795882 BTC at 53,000 and the matching sell fills at 57,000. The fee line adds the quantity bought and the quantity on the sell side and applies the 0.1% rate at 57,000: (0.08795882 + 0.08787086) × 0.1% × 57,000 = 10.02 USDT. Realised profit on the pair is 4,000 × 0.08795882 minus that 10.02, which comes to 341.81 USDT, roughly 1.45% of the 23,610 committed.
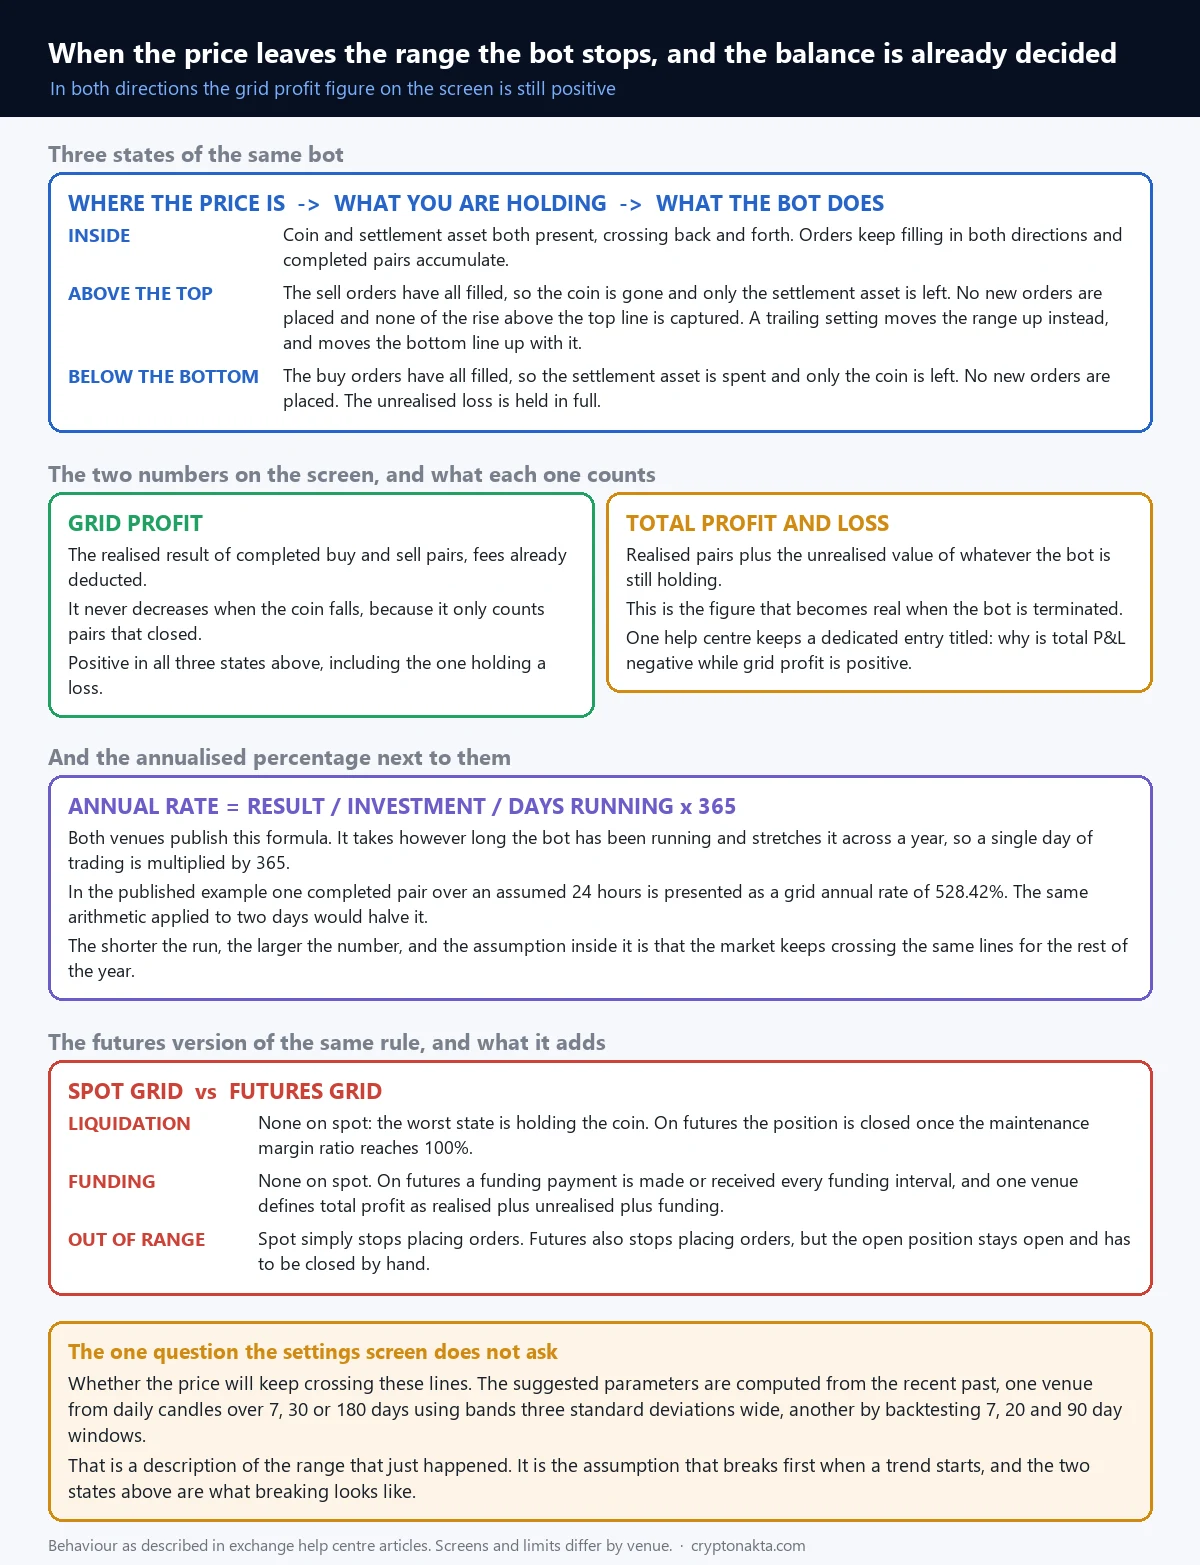
Then the annualising step. The document assumes the bot has been running for one day and computes Grid APR = (341.81 ÷ 23,610) ÷ 1 × 365 = 528.42%. One day of realised profit was multiplied by 365.
The same worked example gives a second figure. Total P&L there is (57,000 × 0.17574172 + 14,452.26) − 23,610 = 859.54 USDT, larger than the 341.81 of realised grid profit, because the example has the price moving from 54,000 up to 57,000 and the bot is still holding BTC that has gained on paper. Reverse the price move and the same slot holds an unrealised loss instead, while the 341.81 stays exactly where it is.
2. Grid Profit, fees, Grid APR, Total P&L: four labels counting four different things
A running bot shows several money figures at once, with names close enough that readers merge them. They count different things.
Binance defines Grid Profit as the profit realised when a buy order and a sell order are matched into a completed pair, fees already deducted. Alongside it sits Float Profit, the gap between the average buy price of what the bot currently holds and the current price.
Bybit uses the same split with different labels. Grid Profit is the sum of realised profit and loss on filled pairs. Total P&L is realised grid profit plus realised fees plus unrealised profit and loss on the inventory still held. Current P&L is realised plus unrealised minus any grid profit already withdrawn. The help centre states plainly that Total P&L is the figure that matters when the bot is closed.
| Label on the panel | What it counts | Value in the published example |
|---|---|---|
| Grid Profit | Realised profit on buy and sell pairs that have both filled, fees already taken out. Says nothing about coins still held. | 341.81 USDT |
| Fees inside that figure | The trading fee charged on the buy and again on the sell of that one pair. | 10.02 USDT |
| Grid APR | Realised grid profit divided by the investment, divided by days running, multiplied by 365. | 528.42% |
| Total P&L | Realised result plus the unrealised profit or loss on whatever the bot is still holding. | 859.54 USDT |
| Float / unrealised P&L | Average buy price of the current holding against the current price. Moves every second and settles only when the position is sold. | Part of the 859.54 Total P&L |
Example conditions, from Bybit’s own documentation: BTC/USDT, market price 54,000 USDT, upper 65,000, lower 45,000, five grids, investment 23,610 USDT, one day assumed, and a price that moved up to 57,000. Change any of those and every figure in the table changes with it.
How Grid Profit stays positive while Total P&L turns negative
Bybit keeps a standing help-centre entry on why total profit can be negative while grid profit is positive.
The mechanism is short. Grid Profit only counts pairs that closed. A buy that filled and has not yet found its matching sell contributes nothing to that number in either direction, while the coins from it remain in the bot and the change in their value is counted in the unrealised part of Total P&L. So a bot drifting down through its range shows a positive Grid Profit from the few pairs that completed on small bounces, and a Total P&L getting worse from the unmatched buys sitting above the current price.
This matters most at shutdown. Closing a strategy realises the unrealised part at the price of that moment, so the final result is the accumulated Grid Profit plus that amount.
3. There is no judgement inside the bot, only a rule about where orders sit
The word “bot” suggests that something inside is deciding. The full description of what a grid bot runs fits in one paragraph, and every exchange that offers the feature describes it the same way.
It takes a price range, a number of grid lines, and an amount of money. It divides the range into that many lines and places a limit order at every line in advance: buy orders on the lines below the current price, sell orders on the lines above. When a buy fills, it immediately places a sell one line up. When a sell fills, it places a buy one line down. That is the complete rule. There is no step in it that reads news, measures momentum, identifies a low, or learns from what happened last week.
Binance states the consequence directly in its documentation: the trading bot executes all orders the instant the set interval is reached, and it does so during sharp drops and sharp spikes as well. As price falls through line after line, the buy orders on those lines fill, exactly as configured, and each fill posts a sell one line higher that may sit there unfilled for a long time. What people describe as the bot buying all the way down is the rule executing as configured.
What can be checked before a bot is switched on is whether the conditions the rule needs are in place.
There are two of them. Condition one: the price has to travel back and forth inside the range, so that buys find their matching sells. Condition two: one grid step has to be wider than the cost of a round trip in fees. The first one is about what price does after the bot starts. The second one is pure arithmetic, and it is settled before the bot starts at all.
4. Four settings, and every other number follows by arithmetic
Four inputs, and every other number on the configuration screen is derived from them by arithmetic. None of the remaining fields asks for a judgement of its own.
The four are the upper bound of the range, the lower bound, the number of grids the range is divided into, and the investment committed. From those: the grid step is the range divided by the number of grids if the spacing is arithmetic, or the ratio (upper ÷ lower) raised to the power of 1 ÷ grids if the spacing is geometric. The order size on each line is the investment divided by the number of grids. The profit a completed round trip on one line produces, after fees, is fixed the moment those four values are entered. It does not depend on how the price gets there.
| Setting | What it determines | What happens when it is off |
|---|---|---|
| Upper bound | The highest line the bot will sell on, and therefore where selling stops. | Set close to the current price and the price leaves through the top early, with the coin sold and none of the further rise captured. |
| Lower bound | The lowest line the bot will buy on, and therefore where buying stops. | Set close to the current price and the price leaves through the bottom, with the cash spent and the coin held at a loss on paper. |
| Number of grids | The width of one step and the order size per line, both at once. | More lines means more fills and a thinner step, so the round-trip fee takes a larger share of each completed pair. |
| Investment | The order size on each line (investment ÷ grids). | If the per-line amount falls under the pair’s minimum order size, the configuration is refused before it starts. |
Every pair has a minimum order size, and dividing a small investment across many lines runs into it quickly. Bybit shows the minimum and maximum investment the chosen range and grid count allow inside the investment field itself, so the configuration that splits a small amount into very many lines never gets created.
The bounds have limits of their own. Each is constrained to a multiple of the market price, and the multiples differ by exchange. Those limits still leave room for a range placed entirely above or entirely below the current price. Futures grids add mode and leverage, which change the risk structure and not the arithmetic.
5. Arithmetic spacing and geometric spacing pay differently per grid
The spacing choice is a single toggle on the configuration screen and it changes what one completed pair pays.
Arithmetic spacing: the same price difference on every line
The step is d = (upper − lower) ÷ grids. In the published example, 65,000 minus 45,000 is 20,000, divided by five grids gives 4,000 USDT per line. Every line is 4,000 apart in price terms. In percentage terms they are not equal: 4,000 on top of 45,000 is about 8.9%, while 4,000 on top of 61,000 is about 6.6%. The lines near the bottom of the range pay a higher percentage than the lines near the top, so profit per grid comes out as a range rather than one figure. Binance publishes both ends of it: the maximum per grid is (1 − c) × d ÷ lower − 2c, and the minimum per grid is (upper × (1 − c)) ÷ (upper − d) − 1 − c, where c is the fee rate, shown as 0.1% in their example.
Geometric spacing: the same percentage on every line
The ratio is r = (upper ÷ lower) raised to the power of 1 ÷ grids. Profit per grid is (1 − c) × r − 1 − c, and that value is identical on every line, top to bottom. Price gaps between lines get wider in absolute terms as the range climbs, so that the percentage stays constant.
Both formulas already subtract the round trip, the fee on the buy and the fee on the sell, which is where the 2c and the extra c come from, so the figure they produce is what is left over. Neither contains a variable for market conditions, volume or time. The number of pairs that complete depends on price, and no field on the configuration screen sets it.
6. One grid step has to be wider than the round-trip fee
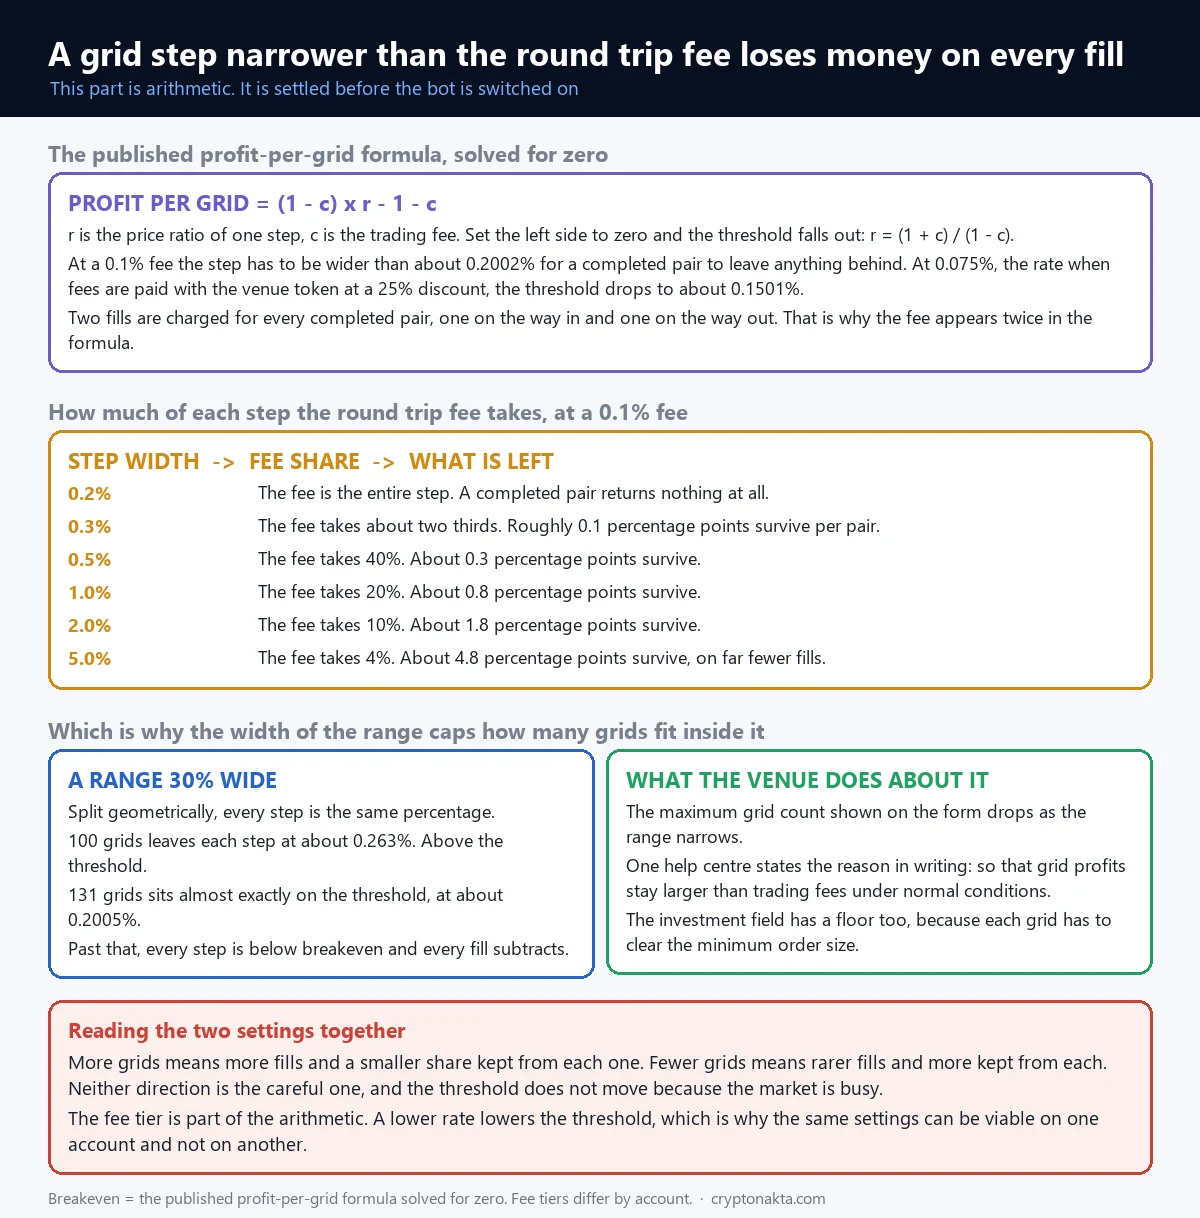
Set the geometric profit formula to zero, the point where a completed round trip leaves nothing behind:
(1 − c) × r − 1 − c = 0, therefore r = (1 + c) ÷ (1 − c)
With a fee rate of 0.1%, which is the standard spot rate at the entry tier on a large venue, r works out to 1.002002. A grid step narrower than about 0.2002% loses money on every completed pair, before anything at all happens in the market. Pay fees with a discount method and the threshold moves: Binance’s 25% reduction for paying in BNB puts c at 0.075%, and the breakeven step drops to about 0.1501%.
Above the threshold, the question becomes how much of the step the round-trip fee takes. A round trip at 0.1% per side costs 0.2 percentage points of the step, whatever the step is, so the share shrinks as the step widens:
| Grid step | Share taken by the round-trip fee | What is left per completed pair |
|---|---|---|
| 0.2% | 100% | Nothing |
| 0.3% | about 67% | 0.1 percentage points |
| 0.5% | 40% | 0.3 percentage points |
| 1% | 20% | 0.8 percentage points |
| 2% | 10% | 1.8 percentage points |
| 5% | 4% | 4.8 percentage points |
Calculated by putting a 0.1% per-side fee into Binance’s published per-grid formula. At a 0.075% fee the breakeven step falls to about 0.1501% and every share in the middle column shrinks by a quarter. These are arithmetic results, not figures announced by an exchange.
The table explains why the intuition “more grid lines means more trades means more money” runs out. More lines do mean more fills. Each fill also returns less per pair, and below 0.2002% every completed pair returns a negative amount however many of them arrive.
Which fee rate applies is an account-level fact. Tiers, discount tokens and referral-linked reductions all move c, so two people running identical settings on the same pair can sit on opposite sides of the threshold. The fee schedules of the major venues are published, and the tools that reduce the rate sit in the account settings.
7. Why a narrow range allows fewer grids, and where the platform ceilings sit
The breakeven step means the width of the range sets a ceiling on how many lines it can carry.
Take a range whose upper bound is 30% above its lower bound and split it geometrically. Each step is 1.3 raised to the power of 1 ÷ n. For that step to stay above the 1.002002 breakeven, n has to come in at roughly 131 or fewer. Ask for 200 lines in that range and every single one of them is structurally negative: each completed pair pays less than the fees it costs.
Exchanges enforce this in the product. Bybit states that the maximum number of grids is reduced automatically when the price range is narrow, and writes the purpose down: to keep grid profit larger than trading fees under normal market conditions.
| Venue and product | Limit set by the venue | Bots running at once |
|---|---|---|
| Binance spot grid | 2 to 500 (dynamic order mode keeps up to 170 live orders around the current price) | 50 strategies across all pairs |
| Bybit spot grid | 2 to 200 grid lines. Upper bound between 0.8× and 3× the market price, lower bound between 0.3× and 1.2× | Documented per product |
| Binance futures grid, USDⓈ-M | 2 to 1,000 | 99 (50 cross, 49 isolated) |
| Binance futures grid, COIN-M | 169 | 50 |
| Bybit futures grid | 2 to 400 | 50 |
These ceilings come from the exchanges’ own help pages. They are product settings that each venue controls and can change, so the number to trust is the one in your own order form. The breakeven arithmetic does not depend on any of them.
The grid count entered is not the number of orders resting on the book at once. Dynamic order mode holds a working set around the current price and moves it along as price moves.
8. The moment price leaves the range: all quote asset, or all coin
The rule carries no instruction for price leaving the range. What the balance is made of at that moment is fixed by which side it left through.
Binance puts it in one line: when the market price falls below the lower limit or rises above the upper limit, the system stops filling orders, and the strategy resumes if price comes back inside the range. The range is not widened and no holding is closed; only the placing of new orders stops.
What matters is the composition of the balance at the moment it stops, and there are exactly two possibilities.
Out through the top: all quote asset, no coin
Price climbed line by line, every sell order filled on the way up, and each sell placed a buy below it that never filled because price kept going. Past the upper bound the bot holds no coin at all and the whole balance sits in the quote asset, usually a stablecoin. Grid Profit is positive and final, and none of the rise after that point is captured. That is the structural reason a grid bot can end up behind simple holding during a sustained rise.
Out through the bottom: all coin, no cash
Price fell line by line, every buy filled, and the sells posted above them are still unfilled. Past the lower bound the cash is gone and the balance is entirely coin, bought at prices above where it trades now, with the unrealised loss carried in full. Grid Profit still shows the positive total accumulated on the way down, because it counts only the pairs that closed.
| Situation | Balance holds | Bot behaviour | Grid Profit display | Total P&L |
|---|---|---|---|---|
| Price moving back and forth inside the range | A mix of coin and quote asset | Buys and sells, pair after pair | Accumulates | Close to Grid Profit |
| Price leaves through the top | Quote asset only, no coin | No new orders, unless trailing up is on and the range follows price upward | Positive, frozen | Misses the whole rise after that point |
| Price leaves through the bottom | Coin only, no cash | No new orders. Waits for price to come back inside | Still positive | Can be well below zero from the unrealised loss |
| Futures grid, out through the bottom | A leveraged position, still open | No new orders, position is not closed | Still positive | Wiped out at liquidation once the maintenance margin rate reaches 100%; before that the position does not close on its own |
9. Trailing up raises the top of the range, and the bottom rises with it
Trailing up is the one feature that changes the range after the bot has started, and it only works in one direction.
When price rises one grid step above the upper bound, the function cancels the lowest outstanding buy order and places a new buy order at the level that used to be the top of the range. The whole band shifts up by one line. If price keeps rising, the process repeats, line by line, so the strategy follows the move upward instead of stopping with everything sold.
It needs at least five grid lines and enough balance for the new order; without those the shift does not happen.
The cost is in the mechanism itself. Moving the top of the range up means moving the bottom up with it, because a line is removed from the bottom for every line added at the top. After several shifts the buy orders below the current price are at levels well above the ones the bot started with. If price rises through several steps and then comes back down to where it began, it drops out through the bottom of the new, higher range, and the bot ends up holding coin bought on the way up.
10. What the automatic parameter suggestions are calculated from
Most configuration screens offer to fill in the range and the grid count automatically, under names that suggest analysis. The inputs are published, and they are simpler than the names.
- Binance spot grid, automatic parameters. Reads daily candles over a lookback of 7, 30 or 180 days, picked by the user, and applies Bollinger Bands at 3 standard deviations to set the upper and lower bounds; the grid count follows from them.
- OKX spot grid, smart strategy presets. Short, medium and long term are backtested over 7, 20 and 90 days of past prices respectively, and the range, grid count and per-grid profit come out of that test.
Both approaches take the width price has travelled over a recent window and carry it forward as the range.
The suggestion measures the past few days or months. A 3-standard-deviation Bollinger band on daily candles describes how far price has swung around its own average over the lookback. A backtest describes what those settings would have produced had they been running over the window. Neither says anything about whether price keeps oscillating in that width.
The suggested bounds hold only while price keeps travelling the same width it travelled over the lookback window. A directional move ends that, and it is the same move that carries price out of the range.
11. The futures version adds liquidation and funding to the same rule
The futures version runs the same rule on a perpetual contract with leverage. The order logic is unchanged: lines, limit orders, opposite order on fill. What changes sits around the rule, and all of it follows from the gap between spot and futures trading.
Three modes
Neutral places sells above the current price and buys below it, and whichever side fills first sets the direction. Long opens with a buy and sells back into the rise; short opens with a sell and buys back on the way down. In those two modes Binance asks whether an initial position should be opened when the bot is created.
Funding moves in or out every interval, and liquidation ends the position
Funding is paid or received every funding interval for as long as the position is open, whether or not any grid line filled. Binance defines total profit on a futures grid as realised profit plus unrealised profit and loss plus funding fees, which puts that flow inside the headline number.
Liquidation is the hard limit. Bybit states that the position is liquidated when the maintenance margin rate reaches 100%, and nothing in the grid rule steps in first. Whether the rest of the account balance can be used as margin for the position depends on the margin mode, isolated or cross, chosen at setup. Binance also shows an estimated liquidation price at creation and publishes the assumption behind it: the figure is calculated as if every pending order in the grid had already filled, so it reflects the full position the bot would hold if every line below the current price had filled.
Leaving the range is a different event here
On a spot grid, leaving the range means the bot stops and the balance sits still. Bybit’s documentation is explicit that a futures grid stops placing new orders while the open position stays open, and closing it is a manual decision. Holding the coin becomes holding a leveraged position, with funding charged or received each interval and a liquidation level that moves as further grid orders fill.
| Spot grid | Futures grid | |
|---|---|---|
| What it trades | Assets held in the balance | Perpetual contracts (USDT-margined on Bybit) |
| Leverage | None | Selected at setup |
| Liquidation | Does not exist | At a maintenance margin rate of 100% |
| Funding | None | Paid or received each funding interval |
| Worst state | Holding the coin with an unrealised loss | Position closed out at liquidation |
| When price leaves the range | New orders stop, balance sits | New orders stop, position stays open |
| Grid lines allowed | Set by the venue’s spot limit | Set by the venue’s futures limit, generally higher |
| Account requirements | Spot balance | Derivatives account with standard identity verification |
Stop conditions are configurable. Binance’s futures grid takes take-profit and stop-loss triggers as a price level, a profit or loss amount, or a return percentage, and asks separately whether the position stays open once the trigger ends the strategy; Bybit allows the investment and the trigger levels to be changed while the bot runs. On top of the two conditions that make the rule pay, the futures version carries a running cost and a level at which the position ends regardless of what the grid was doing.
12. Eight claims about grid bots, set against what the documentation says
Eight statements about grid bots circulate widely enough to be worth setting against what the exchanges write in their own help pages.
| Common claim | What the mechanics say |
|---|---|
| “It buys the lows and sells the highs automatically.” | No component identifies a low or a high. Orders rest at the levels the user entered, and fills happen when price reaches them. |
| “Look at that annualised return.” | Grid APR scales the run so far to a year. In Bybit’s worked example (23,610 USDT, five grids, one assumed day), 1.45% is displayed as 528.42%. |
| “It runs itself, so nothing needs watching.” | The range, the response to a move that leaves it, and the decision to stop sit outside the rule. |
| “More grid lines, more profit.” | Narrower steps raise the fee share of each pair, and below about 0.2002% at a 0.1% fee every completed pair is negative. |
| “The bot will cut the loss.” | There is no stop-loss unless a take-profit and stop-loss trigger is configured. |
| “A subscription is required to use one.” | Bybit writes that the spot grid bot charges spot trading fees only when orders fill, with no additional charge for creating a bot. The cost is the fee on every fill, and the strategy is defined by producing many fills. |
| “It stops buying once a crash starts.” | Binance writes that the trading bot executes all orders the instant the set interval is reached, during sharp drops and sharp spikes alike. Each buy line below the current price fills in turn as price passes it. |
| “It redraws the range when the market moves.” | The range is fixed at setup. Trailing up shifts it upward only, and only where there are at least five grid lines and enough balance to place the new order. |
Two limits sit behind all of it. Nothing in the rule makes price travel back and forth inside the range, and nothing in it picks which asset to run on. Both are settled by the market and by where the bounds were placed.
Grid bots sit on the same account screen as other automation that works on different principles. Recurring buys run on a calendar instead of on price levels. Copy trading mirrors another account’s decisions, so it does contain judgement, just not yours. Earn products pay a yield on deposited assets under counterparty terms rather than by placing orders.
13. The numbers to check on your own account before any of this applies
The rest is account-specific, and three numbers settle it before anything is switched on: the fee rate per side for the tier the account sits in, including any discount method; the minimum order size on the pair; and the grid step the chosen range and grid count produce, as a percentage. The first sets the breakeven step through (1 + c) ÷ (1 − c). The second caps how many lines a given investment can be split into. The third has to clear the first.
The fee rate is the one people carry over from another account without rechecking, and the whole breakeven calculation rests on it. A futures grid adds the leverage, the margin mode and the funding interval, plus the estimated liquidation price, which Binance calculates as if every pending grid order had already filled. Whether a take-profit or stop-loss trigger is set is a separate field; without one there is no ending condition. On Bybit the investment moves out of the Funding account while the strategy runs and returns there with the profit at close.
Where the feature lives
Binance, Bybit, OKX and KuCoin each publish help-centre pages for their own grid products. Which products appear on screen varies by region and account type, so the list your own account shows is the one that applies. Starting from nothing the sequence is an account, a funded balance, then the strategy screen. Where that account is opened is covered in the comparison of major exchanges, in the checks for whether a platform is legitimate and in the patterns behind common crypto scams; the basics of buying a first coin cover the funding step, and what bitcoin is stays the same question whether a person or a bot places the orders.
Binance

Bybit

OKX

KuCoin

Affiliate disclosure: some links are partner links. We may earn a commission at no extra cost to you. This is not investment advice.
The cards list fee rates because that rate is the one part of the per-grid profit formula an exchange sets. The other inputs come from the range, the grid count and the investment.
14. The words on the bot screen, in plain terms
Six more words carry the weight on a grid bot screen and on the help pages behind it.
- Grid step (grid interval). The distance between two neighbouring order levels, in price or in percentage. Range divided by grid count for arithmetic spacing, a constant ratio for geometric spacing.
- Float / unrealised P&L. The gap between the average buy price of the current holding and the current price. It moves every second and settles only when that holding is sold.
- Trailing up. Shifting the whole range one line higher when price passes the top, by cancelling the lowest buy order and adding one at the old upper bound.
- Neutral, long and short mode. A futures-only setting. Neutral lets the first fill decide direction, long opens with a buy, short opens with a sell.
- Maintenance margin rate. How close a leveraged position sits to liquidation. At 100% the position is closed out by the exchange.
- Limit order. An order to trade at a specified price or better, which rests on the order book until price reaches it. Every order a grid bot places is one of these.
Grid Profit, Total P&L and Grid APR are the three that get read as one figure. Grid Profit counts closed pairs only, Total P&L adds the holding that is still open, and Grid APR scales whatever period has run so far to 365 days.