USDT vs USDC: which is safer · redemption terms, chains and book depth
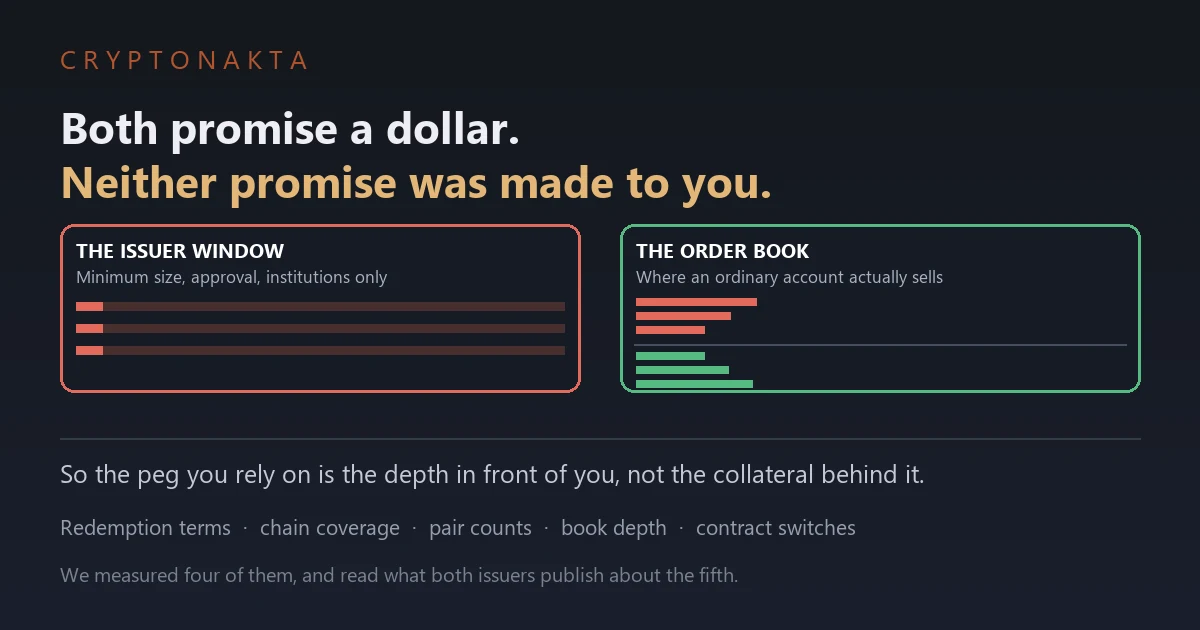
The dollar promise is written for institutions, not for you. Your exit is an order book, which makes depth the layer that decides what happens when you sell.
| Question | Short answer |
|---|---|
| What is the actual difference? | Different issuer, different chains underneath, and a different set of places you can sell. The dollar target is the same. |
| Do they trade one for one? | No. At the time we measured, every exchange we checked priced one of them slightly above the other. |
| So which one is safer? | This article does not hand you a winner. It splits safety into three layers and shows which layer you can check yourself. |
| Isn’t the dollar guaranteed by the issuer? | The issuer window is built for institutions. One publishes a minimum size, the other states on its own page that it is not for individuals. |
| Then what is my exit? | An exchange order book. That is why the last layer of safety is depth, not collateral. |
| Does the chain matter? | A lot. One of the two is effectively absent from a chain that carries a large share of everyday transfers. |
1. Safer is three questions wearing one word
2. They do not trade one for one
3. One snapshot proves nothing, so we counted the years
4. Who the dollar promise is actually made to
5. Which leaves the order book as your exit
6. The places you can sell are not the same size
7. The rails underneath are different
8. Both contracts come with switches
9. The two times they broke, counted in minutes
10. The minute nothing happened at all
11. What the issuers publish, and what we could not read
12. Choose by what you are doing, not by the brand
13. Five minutes on your own screen
Most comparisons of these two hand you a winner in the first paragraph. This one starts by pricing them against each other, because the exchange screen says something the verdicts leave out. The two do not trade one for one, and the gap has held a direction for months. We also read what both companies publish about handing dollars back, called the token contracts directly, and counted the order books on both sides.
1. Safer is three questions wearing one word
Search the question and you get a verdict. One coin is the careful one. The other is the risky one. Pick accordingly.
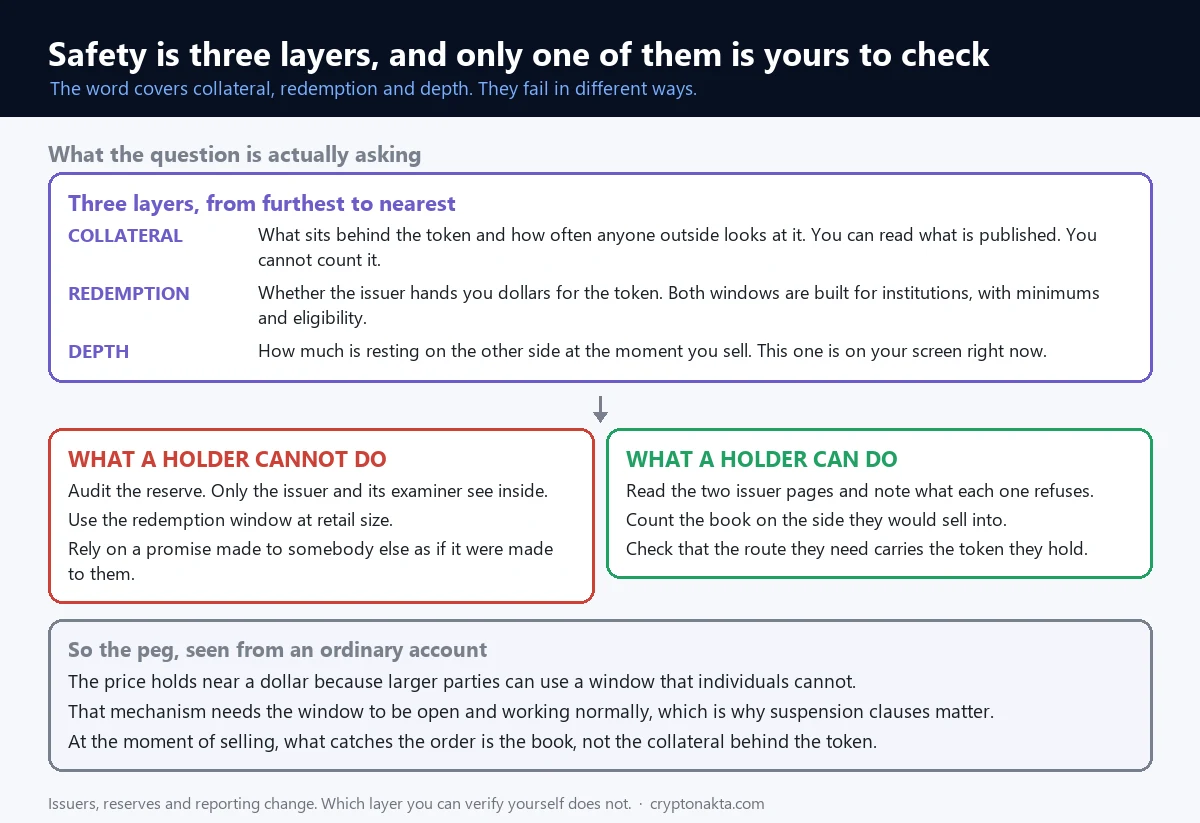
The trouble is the word safer. It is doing three jobs in that sentence. The three answers are not the same.
Three things people mean by safer
The first is collateral. What sits behind the coin, and who outside the company looks at it.
The second is redemption. Whether the company hands you a dollar for the coin, and on what terms.
The third is depth. Whether enough money is standing on the other side of the screen when you want out.
These are not three versions of one question. They have different answers. They fail in different ways. And only one of them is something you can check before you press the button. That last point decides the shape of this article.
A few words, defined once
A stablecoin is a token that aims to hold a fixed value in some currency. Both of these aim at one US dollar. If the category is new to you, start with the plain explanation of stablecoins instead.
The peg is that aim. Pegged to a dollar means held near a dollar. It does not mean welded to one.
Reserves are the assets an issuer says are behind the tokens in circulation. Redemption is handing tokens back to the issuer for dollars. Selling on an exchange is a different act. There you hand them to another trader.
A pair is what you can trade directly against what. Buying one of these with your local currency happens in one pair, and buying bitcoin with it happens in another. If the pair you need is not on the screen, you convert first and trade second.
And bps appears throughout. One bps is 0.01%. The gaps here are small. Written as percentages they turn into a row of zeros, and counting zeros is how mistakes happen.
Where this article starts
Not with a company. With the number on the exchange screen. That number disagrees with the tidy story about two identical dollars.
2. They do not trade one for one
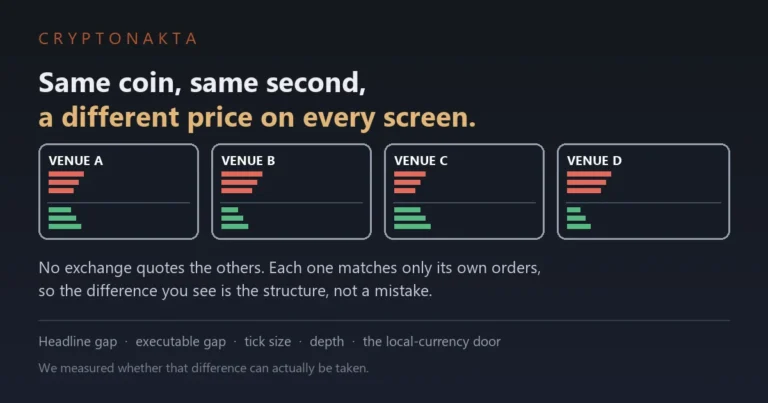
Open a swap screen and price one against the other. The number that comes back is not 1.0000.
Six books, same moment
We pulled the top of the book from six exchanges at once. The direction was unanimous. That is the part worth noticing.
| Exchange | Sell USDC, you receive | Buy USDC, you pay | Distance from 1.0000 |
|---|---|---|---|
| Binance | 1.00072 | 1.00073 | 7.2 bps |
| Bybit | 1.00070 | 1.00080 | 7.5 bps |
| OKX | 1.00070 | 1.00071 | 7.0 bps |
| KuCoin | 1.00060 | 1.00070 | 6.5 bps |
| Bitget | 1.00072 | 1.00073 | 7.2 bps |
| Gate | 1.00070 | 1.00080 | 7.5 bps |
Measured 2026-09-17 15:54 UTC. Public endpoints only, no keys. Six exchange books, eight chain contracts, two Ethereum contracts called directly. Top-of-book quotes at that instant. Run it again and the digits move.
The distance sat between 6.5 and 7.5 bps. That is 0.065% to 0.075%. Small, and also consistent: six venues, six times the same sign.
What a round trip costs
Say you move ten thousand dollars across and back. You buy at the higher number. You sell at the lower one. The gap between them is charged to you on each leg.
At the time we measured, that gap ran from 0.1 to 1.0 bps depending on the venue. The exchange’s trading fee sits on top of it.
For a single conversion this is noise. The amount is not why it opens the article. The market is not treating the two as the same object. A price difference is how a market says it sees a difference.
Two separate costs
One is the spread. That is the distance between the price you buy at and the price you sell at. Take liquidity with a market order and you pay it every time.
The other is the trading fee. It depends on your tier. It also depends on whether your order rested in the book or crossed it. Resting orders are usually cheaper.
So one conversion costs one spread plus one fee. A conversion you later undo costs two of each. Converting because you need to is fine. Converting back and forth out of habit is a slow leak.
3. One snapshot proves nothing, so we counted the years
One snapshot proves nothing. A price can be odd for a minute. So we went back and counted.
2,669 days of closes
We pulled the daily candles for that pair from 2018-12-15 to 2026-09-17. That is 2,669 days. On 39 of them the close sat more than 1% away from 1.0000.
That is the first honest finding here, and it cuts against the drama. On almost every day in the record, both coins did what they were supposed to do.
But which side of 1.0000
Sitting near the peg is not the same as sitting on it. So we counted the days that closed above 1.0000. Above means USDC was the pricier of the two.
Over the last 90 days, 2026-06-20 to 2026-09-17, that was 83 days. That is 92.2%, or nine days in ten. The average distance was 5.68 bps.
Widen it to a year, 2025-09-18 to 2026-09-17, and it falls to 235 days. That is 64.4%, averaging 2.49 bps.
So the tilt is recent. Further back the pair crossed over itself more often. Lately it mostly does not.
We stop at the observation
Why the tilt exists is a question about who has been buying and selling, and why. We did not measure that. Assigning a cause here would be storytelling.
The count supports something narrower. The market prices the two differently, and the difference can hold a direction for months.
That matters for everything below. A dollar promise that worked perfectly for everybody would not leave a gap sitting there for ninety days.
4. Who the dollar promise is actually made to
So who is the promise made to? Both companies answer that on their own sites. They answer it in plain language, and more specifically than the marketing around them.
What the two issuers publish about getting dollars back
| Term | USDT issuer | USDC issuer |
|---|---|---|
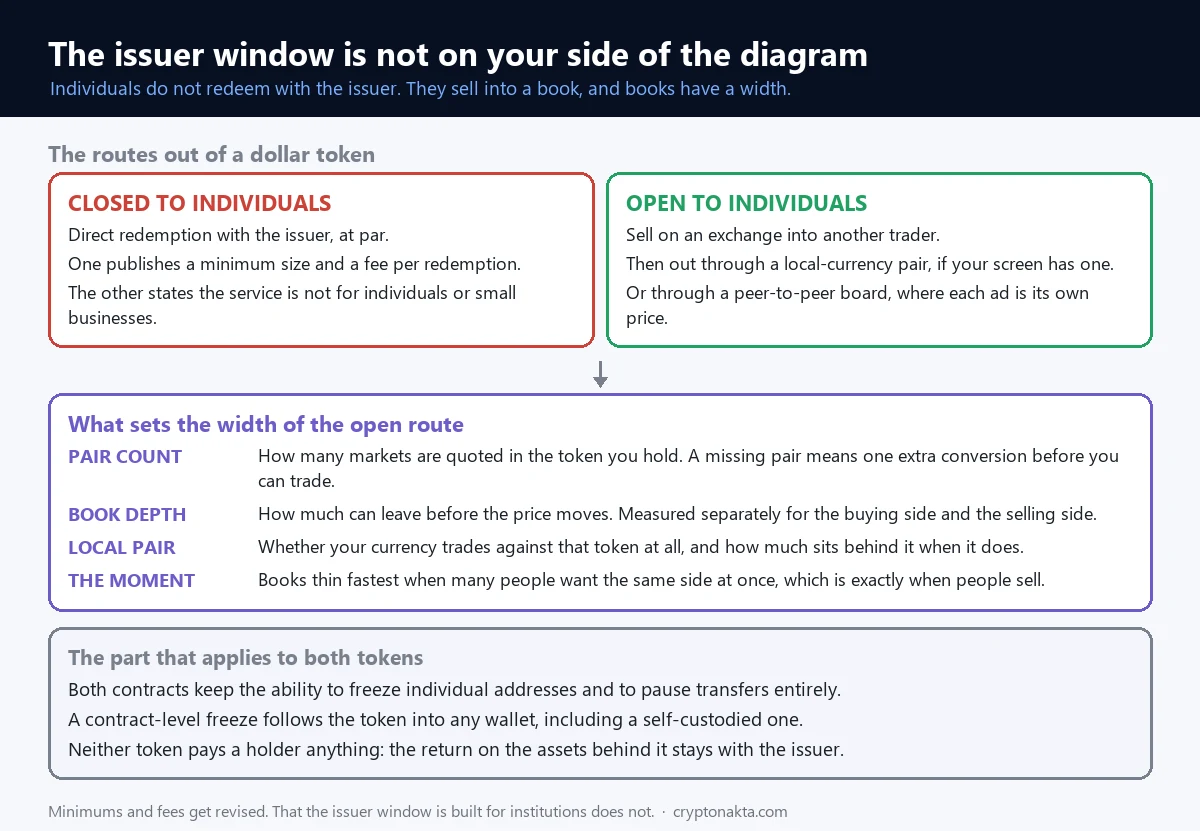
| Can an individual redeem directly | Only through an approved, verified account; the page states approval is at the company’s discretion | The page states the mint and redeem service is not available to individuals or small businesses |
| Minimum size | 100,000 dollars | Described as a service for exchanges, institutional traders and banks |
| Account verification fee | 150 dollars | Not applicable |
| Fee to redeem | The greater of 1,000 dollars or 0.1% | Not applicable |
| Can redemption be paused | The disclosure document lists cases where redemption may be delayed or suspended | What we could read is the line above |
Read directly from both companies’ public pages on 2026-09-18. Quoted only as far as we could read them.
Read that first row again
Say you hold a few hundred dollars of either coin. Neither issuer is your counterparty in any practical sense. One sets a floor far above your balance. The other says plainly that the service is not for you.
This is not a scandal. It is not hidden either. It is how the product is built. It is also the most load-bearing point in the whole comparison, which is why almost nobody writes it down.
Then why does the price stay at a dollar?
Because somebody else can use that window. Large trading firms and exchanges clear the minimums.
Suppose the market price drops well below a dollar. Buying cheap and redeeming at par becomes arithmetic rather than a view. If it runs above par, the reverse does.
That activity pulls the price back. So the thing holding your balance near a dollar is not an agreement between you and the issuer. It is that someone much larger than you can use a window you cannot.
A condition comes attached. That window has to be open and working normally.
The suspension clauses exist for the cases where it is not. The issuer document lists a prohibited use, a direction from a government or law-enforcement body, an account under litigation or investigation, or suspected fraud.
How governments are writing rules around all this is a separate subject. We keep it out of here. The explainer on the US stablecoin law covers that ground.
5. Which leaves the order book as your exit
Put the last two sections together and the question changes shape. Not “is the collateral good”. Rather: when I want out, who is on the other side?
Order book vocabulary, once
An order book is the list of resting buy and sell orders at each price. Every exchange runs its own.
The bid is the highest price someone is offering to buy at. Sell right now and that is what you get. The ask is the lowest price someone is offering to sell at. The distance between them is the spread.
Walking through those levels is laid out step by step in the piece on order books and slippage.
Measuring the exit
We walked each book from the top, adding price times size. We stopped when the price had moved half a percent. That total is how much can leave without pushing further than that. We did it in both directions.
| Exchange | Selling USDC, within 0.5% | Buying USDC, within 0.5% | Ratio |
|---|---|---|---|
| Binance | 52.9 | 23.0 | 2.30× |
| Bybit | 30.7 | 17.2 | 1.79× |
| OKX | 10.6 | 15.6 | 0.68× |
| KuCoin | 4.2 | 2.7 | 1.52× |
| Bitget | 22.4 | 17.5 | 1.28× |
| Gate | 37.9 | 23.9 | 1.58× |
Figures in millions of dollars. Measured 2026-09-17 15:54 UTC. Public endpoints only, no keys. Six exchange books, eight chain contracts, two Ethereum contracts called directly. Exchanges cap how many levels they publish. Where the cap was reached, the real number is larger than shown.
The two directions are not mirror images. At retail size either side is deep enough that none of this shows. The table is not about the absolute figures. It is that depth has a direction, and the one that matters is the direction you sell into.
Depth is a snapshot, not a property
Resting orders arrive and cancel constantly. A book that is thick now can be thin in an hour. It thins fastest when many people want the same side at once.
So treat the table as a sense of the normal state. Before selling something large, look at the book in front of you. Not at a number from a blog.
How to count it yourself
Open the book and look at the bid side. Multiply the top price by the size on that row. That is what the first level absorbs. Do the same for the next row and add it.
Keep going until the price is half a percent below where it started. If your order fits in the first row or two, the price you see is roughly the price you get. If it takes ten rows, it is not.
6. The places you can sell are not the same size
Depth is one part of the exit. The other is whether the exit exists on your screen at all.
Counting the pairs
Each exchange publishes its list of tradable pairs. We counted how many are priced in one coin versus the other.
| Exchange | Pairs priced in USDT | Pairs priced in USDC | Ratio |
|---|---|---|---|
| Binance | 493 | 268 | 1.8× |
| Bybit | 395 | 85 | 4.7× |
| OKX | 406 | 292 | 1.4× |
| KuCoin | 835 | 58 | 14.4× |
Measured 2026-09-17 15:54 UTC. Public endpoints only, no keys. Six exchange books, eight chain contracts, two Ethereum contracts called directly. Only pairs currently open for trading were counted.
The spread between venues is wide. It runs from about 1.4 to one at the low end up to roughly 14.4 to one at the high end. Same two coins, very different shelf space.
Why a missing pair costs money
Suppose you hold the coin that is not quoted against the asset you want. You convert first, then buy. That is one extra trade.
One extra trade means one more fee, plus one more trip across the gap from the opening section. The amount is small. It comes from the shape of the screen rather than from anything about the coin.
Local currency pairs
The fiat side is where the asymmetry gets sharper. Some currencies trade against both coins. Some trade against only one. On the venue whose fiat list we read in full, AED appears against one of the two and not the other.
Where both pairs exist, the books behind them are not the same size. Measured in the same half-percent band, one side was about 2.0 times deeper in Brazilian real. In Argentine peso it was 5.9 times. In Mexican peso 6.1 times, and in Turkish lira 36.6 times.
Converted to dollars at each pair’s own mid price so the depths are comparable. Measured 2026-09-17 15:54 UTC. Public endpoints only, no keys. Six exchange books, eight chain contracts, two Ethereum contracts called directly.
Which pairs appear depends on where you are. Check your own account screen rather than this list. The practical rule is short. If you plan to cash out into a local currency, look at that currency’s pair before choosing which coin to hold.
7. The rails underneath are different
The last structural difference sits under the hood. It is which chains these tokens live on.
We asked the contracts
Every deployment is a contract on some chain. A contract will tell you its total supply if you ask. We asked eight of them, on public nodes, without a key.
| Chain | Share of measured USDT | Share of measured USDC |
|---|---|---|
| Ethereum | 46.5% | 75.9% |
| Tron | 49.6% | 0.0% |
| Solana | 2.0% | 11.8% |
| Base | 0.0% | 6.5% |
| Arbitrum | 0.4% | 4.0% |
| Avalanche | 1.0% | 0.6% |
| Polygon | 0.4% | 0.9% |
| Optimism | 0.1% | 0.3% |
Measured 2026-09-17 15:54 UTC. Public endpoints only, no keys. Six exchange books, eight chain contracts, two Ethereum contracts called directly. Shares are of the eight deployments we measured. Both tokens also exist on chains outside this list.
Two different maps
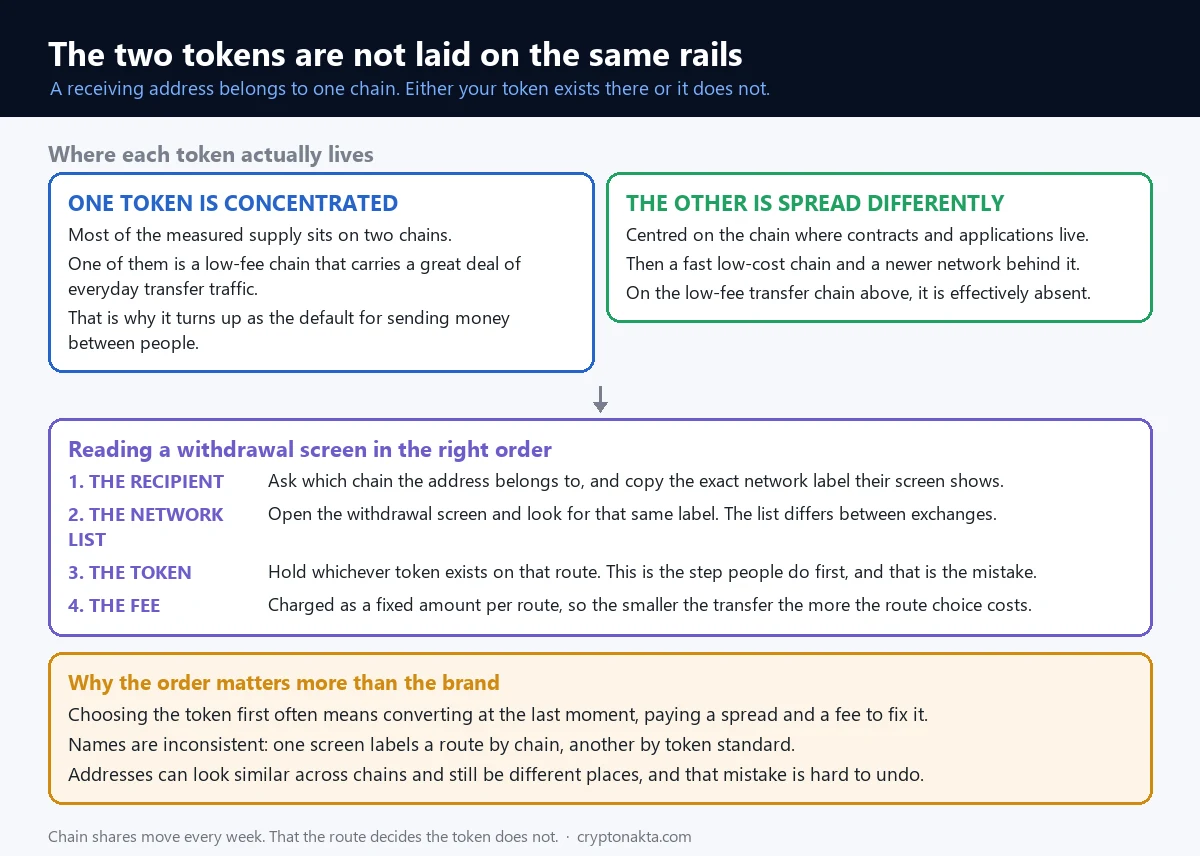
USDT is concentrated. Two chains hold 96.1% of what we measured. USDC is centred on Ethereum, with Solana and Base behind it.
One cell changes decisions. A low-fee chain carries an enormous amount of everyday transfer traffic, and USDC is effectively not on it. Our measurement put it at 0.00%.
So the order of decisions flips. You do not pick a coin and then find a route. The route decides the coin. The recipient’s address belongs to one chain, and either your token exists there or it does not.
What this looks like on the withdrawal screen
Pick a coin to withdraw and the exchange shows a network list. That list is the set of routes it supports. It differs between exchanges.
The network you pick has to match the network of the receiving address. Addresses can look similar across chains and still be different places.
Naming is inconsistent too. One screen labels a route by chain name, another by token standard. When in doubt, match the exact label the receiving side shows you.
Fees vary by route as well. They are charged as a fixed amount, so the smaller your transfer, the more the route matters.
Both points are unpacked in the comparison of USDT networks and the piece on network fees. The cost of moving between exchanges is measured in the transfer cost article.
8. Both contracts come with switches
This section is about something both coins share. It is not a point against either one.
Calling the contracts directly
Both tokens run as contracts on Ethereum. Those contracts expose functions anyone can call. A few of them describe what the issuer is able to do.
A blacklist is a list of addresses whose tokens cannot move. Both contracts keep the ability to manage one.
| What we called | USDT contract | USDC contract |
|---|---|---|
| Is everything paused right now | No | No |
| Who can pause it | An owner address is set | A dedicated pauser address is set |
| Freezing individual addresses | Supported; querying it returns addresses that are in fact listed | Supported, with a dedicated administrator address |
| A fee-on-transfer parameter | Present in the contract, currently set to 0 | No such parameter |
Measured 2026-09-17 15:54 UTC. Public endpoints only, no keys. Six exchange books, eight chain contracts, two Ethereum contracts called directly. Values read from public nodes at that moment.
What it means in practice
Nothing is paused. The fee parameter is zero. There is no story here about something happening. The structure is the story.
Holding these tokens in your own wallet, with your own keys, does not put them beyond the contract. A coin whose ledger has no administrator works differently. This applies to both of these equally.
The issuer disclosure we read goes further. It says the company may act to freeze tokens held in external wallets it holds no keys for. It names requests from law enforcement, regulators or government agencies.
What a freeze looks like from the inside
The balance still shows. Nothing disappears from the screen. The transaction simply fails when you try to move it.
An exchange blocking a withdrawal is different. That only binds while your coins sit on that exchange. A contract-level freeze travels with the token into any wallet.
This capability gets used in both directions. Stolen funds have been frozen this way. For a holder the point is neither approval nor alarm. It is accuracy. These tokens arrive with a switch attached, and someone else holds it.
Risks that come from where you keep them are separate. Those are covered in what happens when an exchange goes bankrupt.
9. The two times they broke, counted in minutes
Both of these have had a bad week. The records are public. We opened them minute by minute instead of repeating the headlines.
| What we counted | The USDC episode | The USDT episode |
|---|---|---|
| Date | 2023-03-11 | 2022-05-11 |
| Furthest the price went | Down to 0.882 | The pair spiked the other way, implying 0.251 |
| Minutes spent more than 0.5% off | 4,813 | 843 |
| Back inside 0.5% after the extreme | 51.8 hours | 8 minutes |
Counted from one exchange’s minute candles. We did not measure the causes, so we do not assert them.
Different shapes, not different grades
One went deep and stayed there. More than two days passed between the low and the return.
The other was a spike. The extreme print was larger. It was over in minutes.
Why we counted minutes instead of the low
The lowest print is the number that gets quoted. Very few people traded at it. Most people lived through the hours around it. They kept deciding whether to sell into a price that was wrong.
4,813 minutes is close to three days of that. 843 minutes is an afternoon. Those are different experiences of the same kind of event, and a headline number hides the difference.
Across the whole record
Out of 2,669 days, 39 closed more than 1% away from par. That is about 1.5%. Rare, in other words.
The table is here to show one thing. When it does happen, the two do not break in the same way. It is not here to suggest it happens often.
10. The minute nothing happened at all
Those two episodes had reasons behind them. The next two did not.
One minute, 2021-12-04
Inside a single minute the price printed as low as 0.20. It closed that same minute at 0.9982. There were 1,678 trades in it.
Was the whole market falling apart? We pulled bitcoin for the ninety minutes either side. The drawdown across that window was 2.25%. An ordinary afternoon.
And again on 2024-01-03
Low of 0.76, closing the same minute at 0.9979. This time the market really was moving. Bitcoin was down 9.69% across the same window, with 25,932 trades in that one minute.
This is the argument of the article, in two prints
Nothing happened at either issuer on those days. No reserve vanished. And a token worth a dollar traded at a fraction of one, then was fine again before the minute ended.
An order that says sell now, whatever the price takes the best bid. Then the next one. Then the next. When enough of them arrive together, the upper rows empty out. Whatever is left at the bottom is where the trade happens.
So the peg, from where you stand, is not a promise. It is the depth of the book at the moment you hit sell. Most of the time the book is thick enough that the distinction never comes up.
Who sells at twenty cents?
Mostly nobody, deliberately. Those prints are usually resting instructions firing on their own. A stop order left at 0.99. A leveraged position being closed out automatically.
The condition triggers and the order goes to market. If the book is thin at that instant, it fills far below where anyone expected.
A limit order would not have filled there. That is the practical version of this section, and the reason the order types article exists.
11. What the issuers publish, and what we could not read
Back to the first layer, collateral. Here we cannot measure anything. We can only read.
What each company says about disclosure
The USDC side states that reserve holdings are disclosed weekly. It states that a large accounting firm provides monthly third-party assurance. It describes the reserve as short-dated government paper and bank deposits.
The USDT side states that reserve reports are published quarterly, with an independent accounting firm’s report attached. It also states that tokens in circulation are published daily.
So the cadence differs. Weekly against quarterly for holdings. Monthly against quarterly for outside review. That is the extent of what we verified by reading.
Both companies’ public pages read on 2026-09-18.
Why there is no percentage table here
We could read one side’s composition on the page. We could not read the other’s.
Publishing a detailed breakdown for one and a blank for the other would read as a verdict on the second. It would really be a statement about what our browser could reach.
So we stopped at the format. If composition matters to your decision, both companies publish it themselves. That is the version worth reading, not ours.
We also left out a total supply comparison. We measured eight deployments. That is a large share of each token, but not all of either. A ranking built on a partial count ranks our measurement, not the market.
12. Choose by what you are doing, not by the brand
None of this resolves into “buy this one”. It resolves into a different first question. What are you going to do with it?
If it never leaves the exchange
Look at which of the two your usual markets are quoted in. If your assets have pairs in both, this barely matters. Hold whichever your exchange charges less to use.
If they are quoted in only one, holding the other means an extra conversion every time.
If you are sending it somewhere
The receiving side decides. Get the chain first. Confirm the exact network label on their screen. Then hold whichever token exists on that route.
Choosing the token first and the route second is how people end up converting at the last moment and paying for it.
If you are parking value for a while
Look at the depth where you intend to sell. Look also at where the pair trades relative to 1.0000 when you enter.
Buying at one price and leaving at a lower one is a real cost, even if a small one. No yield offsets it either. These tokens pay you nothing for holding them, and the return on the assets behind them stays with the issuer.
If the amount is large
Then depth stops being trivia. It becomes your execution price. Count the book instead of reading the top line. Split the order. Consider more than one venue.
The article on why prices differ between exchanges measures how far apart venues sit at the same instant. The fee breakdown covers the charges stacked on top.
Two things follow you either way. The issuer window is not for individuals. Both contracts keep the ability to freeze. Neither goes away with the choice.
If you are picking an exchange rather than a token, the five-minute exchange checklist is the companion piece.
Binance

OKX

Bybit

Affiliate disclosure: some links are partner links. We may earn a commission at no extra cost to you. This is not investment advice.
13. Five minutes on your own screen
Five minutes, your own screen, no trust required.
1. Price them against each other
Find the pair that quotes one against the other. Read the bid and the ask. Note how far from 1.0000 it sits and how wide the gap is. That is what a conversion costs today.
2. Find the pair you would sell into
If you plan to cash out into a local currency, check whether that currency trades against both coins on your exchange. Compare the 24-hour volume behind each one. That shows how much is actually moving through it.
3. Count your own size into the book
Open the book and take the bid side. Multiply price by size, row after row, until you reach the amount you would sell. If you finish in the first rows, the quoted price is roughly your price.
4. Check the route before the token
Look at the network list on the withdrawal screen. Look at the network your recipient expects. If that combination is not offered, that token cannot take that road.
5. Send a small one first
For any route you have not used before, move a small amount and confirm arrival. Then send the rest. You pay the fixed fee twice. That is cheaper than a transfer landing somewhere you cannot reach.
How I read all of this
I stopped treating this as a question about two companies. The three layers do not weigh the same. I cannot audit the first. I am not eligible for the second. The third is on my screen right now with a number attached.
So the honest version of “which is safer” is narrower. Which one is deeper where I actually sell, and is my route paved with it? That answer changes by country, by exchange and by chain. A single verdict was never going to survive contact with your account.
Where this article stops
It stops at measuring. It does not tell you what to buy. It does not suggest trading the gap between them either. That calculation is run, with numbers, in the price difference article, and the fees usually get there first.
What happens after you convert to cash is its own subject. The account freeze article covers the part people get caught by. If you are still deciding how to acquire either one, the buying guide compares the routes.
Frequently asked questions
Next: how an order book fills, and why large orders pay more than the price on screen